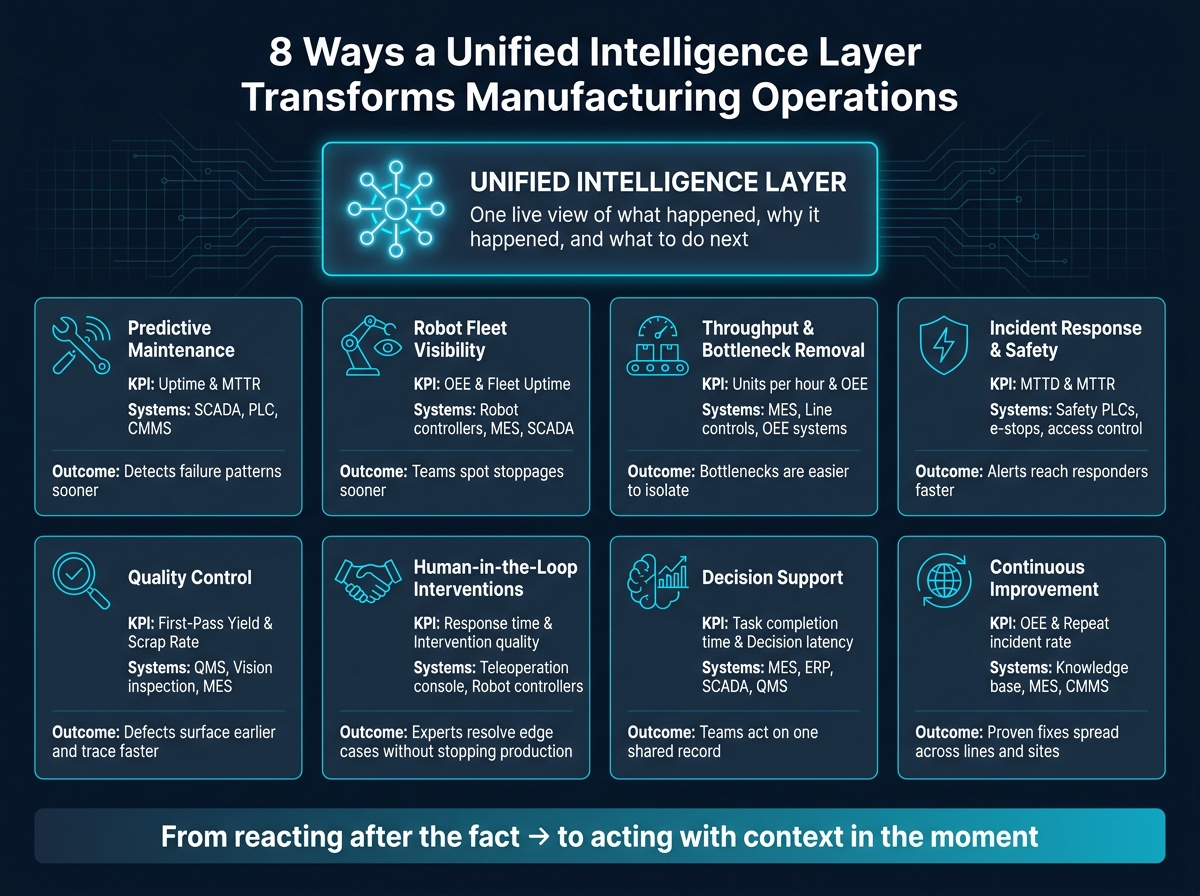
8 Ways a Unified Intelligence Layer Transforms Manufacturing Operations

Leela Yanamaddi
August 22, 2026
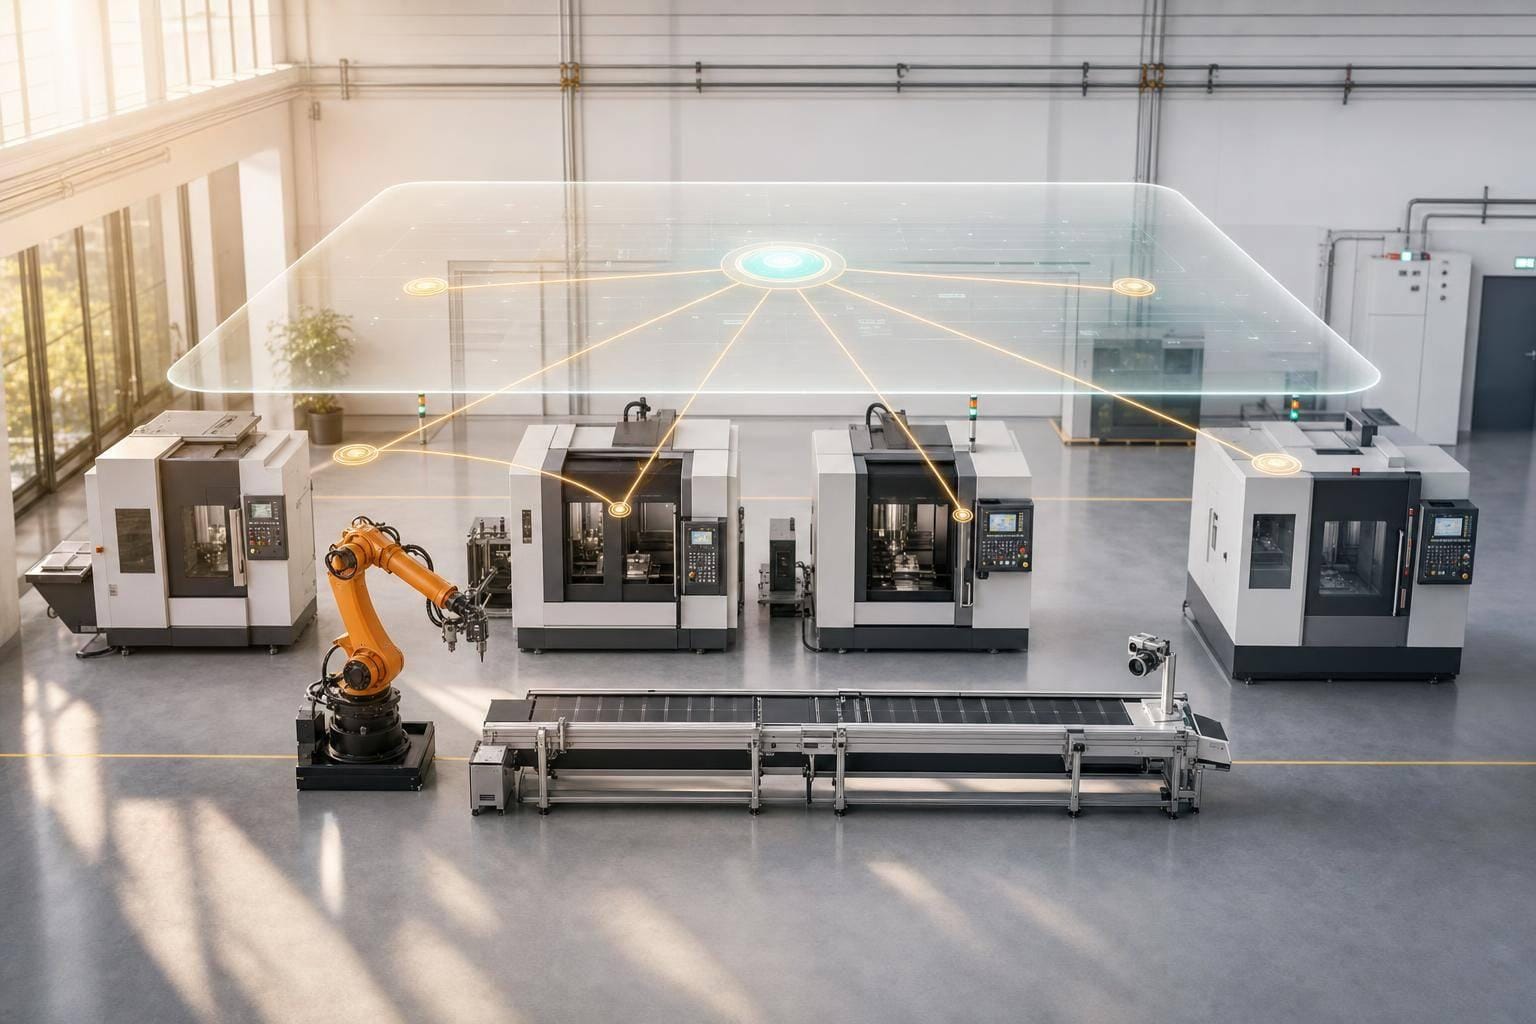
Most factory delays are not caused by a lack of data. They happen because the data lives in different systems. I’d sum up the article like this: when I connect robot telemetry, machine status, worker actions, production flow, and quality records into one live layer, I can cut downtime, spot bottlenecks sooner, improve safety response, and make plant decisions with less guesswork.
Here’s the short version of what this layer does for manufacturing teams:
- Cuts unplanned downtime by linking live equipment signals with service history
- Shows robot fleet status in one place across cells, lines, and sites
- Finds throughput loss sooner by tying cycle time, WIP, and labor activity together
- Improves incident response by putting safety, machine, and worker signals in one view
- Tightens quality control by linking inspection results with process data and operator notes
- Supports human review and teleoperation when automation needs help
- Gives teams one shared record for day-to-day decisions
- Helps spread fixes across sites instead of solving the same problem again and again
In simple terms, I see this as a shift from reacting after the fact to acting with context in the moment.
Quick comparison
| Area | What gets connected | Main KPI |
|---|---|---|
| Predictive maintenance | Telemetry, sensors, service records, operator notes | Uptime, MTTR |
| Robot fleet visibility | Status, faults, use rates, idle time | OEE, productivity |
| Throughput | Cycle times, WIP, queue depth, labor activity | Units per hour |
| Incident response | Safety systems, e-stops, access logs, worker feeds | MTTD, MTTR |
| Quality control | Vision data, SPC, machine settings, operator input | FPY, scrap rate |
| Human review | Robot, vision, PLC, MES, WMS, alerts | Throughput |
| Decision support | MES, ERP, SCADA, QMS, worker records | Response time |
| Cross-site improvement | Fix history, standards, alerts, maintenance logs | OEE |
If I had to boil the whole piece down to one point, it’s this: a unified layer gives factory teams one live view of what happened, why it happened, and what to do next.
8 Ways a Unified Intelligence Layer Transforms Manufacturing Operations
How Manufacturers Scale from Fragmented Data to AI-Native Intelligence: Data Layer, UNS, MCP, I3X
What a Unified Intelligence Layer Actually Connects
Here’s the starting point: in a lot of plants, the data is already there. The problem is that it lives in separate systems that don’t talk to each other.
On the control and equipment side, the layer connects PLCs, SCADA systems, robot controllers, vision systems, and sensors. On the management side, it links MES, ERP, CMMS, and QMS platforms, pulling in production orders, maintenance schedules, work orders, and quality inspection records. Safety systems and operator inputs fill in the rest, adding alerts and manual corrections from the floor.
Those signals come together into five core data types:
| Signal Category | What It Captures |
|---|---|
| Robot telemetry | Joint health, cycle performance, fault history, uptime |
| Machine data | Equipment states, sensor readings, temperature excursions |
| Worker activity | Operator interventions, manual corrections, manual overrides |
| Production workflow data | Order status, throughput, scheduling changes |
| Alerts | SPC violations, SCADA alarms, safety system triggers |
The main value here is context, not just more data.
A SCADA alarm by itself only tells you that something tripped. That’s useful, but it doesn’t tell the whole story. When you line that alarm up with robot telemetry, maintenance records, and operator input, you get a much clearer view of what happened and why.
That’s the point of the layer. It turns isolated alarms into something teams can act on, shifting the focus from reacting in the moment to finding root causes.
Once those signals are connected, the first payoff is predictive maintenance.
1. Reduce Downtime with Predictive Maintenance
Unplanned downtime is one of the most expensive problems in manufacturing. The fix gets a lot more practical when telemetry, maintenance history, and operator input all live in one view.
The Operational Problem
Old-school maintenance usually does one of two things: it reacts after something breaks, or it follows a set calendar whether the machine needs service or not. Predictive maintenance takes a better path. It uses live signals to spot trouble before downtime begins.
Signals Unified
A unified intelligence layer brings together robot telemetry, machine sensor data, CMMS records, and operator notes, overrides, and corrections. That extra context matters. It helps teams see whether an anomaly is a one-off issue or part of a shared failure pattern across the line.
Primary KPI Affected
Primary KPIs: uptime and MTTR. When teams can spot issues earlier and see more of what’s happening, they can move through repairs with less guesswork, shorten repair cycles, and cut unplanned downtime.
Example Systems Integrated
The layer links live telemetry with maintenance history and alerts, so teams can step in before the line goes down.
Once maintenance connects to live operations, the next move is getting a full view of the robot fleet in real time.
2. Get Real-Time Visibility Across Your Robot Fleet
Without one shared view, operators end up piecing together robot status, utilization, and faults from different tools. That creates blind spots in the day-to-day workflow. And by the time a fault or spike in idle time stands out, the response is already behind.
The Operational Problem
Most factories don't have a shortage of robot data. The problem is that the data isn't connected.
Status feeds, utilization logs, and fault alerts often sit in separate dashboards, so operators have to manually rebuild the story of what's happening across the floor. It’s a bit like trying to follow a game by looking at three scoreboards in three different rooms.
Signals Unified
A unified intelligence layer brings live robot status, utilization rates, idle time, queue depth, and fault diagnostics into one live view across all cells, lines, and sites. It also keeps investigation history tied to each alert, so teams don’t have to start from scratch every time they look into an anomaly.
Primary KPI Affected
Primary KPIs: OEE and productivity. When teams can see idle time and fault conditions in real time, they can respond faster. That makes fleet-level intervention faster and more precise.
Example Systems Integrated
Connecting robot controllers, PLCs, MES, and SCADA into one unified layer makes fleet-level monitoring possible.
With fleet status visible in real time, the next step is finding where flow slows down.
3. Improve Throughput and Remove Bottlenecks
Throughput usually starts slipping before a line comes to a full stop. WIP stacks up, cycle times get longer, and handoff delays chip away at output little by little.
The Operational Problem
These losses almost never show up clearly in one system. So teams can watch output drop without knowing where the slowdown began or what's causing it right now.
Signals Unified
A unified intelligence layer brings together robot telemetry, machine cycle times, WIP queue length, labor activity, and production workflow states. That gives operators one clear view of where flow is slowing.
For example, the system can show whether:
- a robot is running below baseline
- a station's queue length is growing
- a handoff is taking too long
It can also track target rates at each step and flag deviations as soon as they show up. That means teams can step in earlier, before one slowdown ripples across the rest of the line.
Primary KPI Affected
The main KPI here is units per hour. Cycle time and OEE tend to move with it. If teams catch throughput losses early, they can recover output that might otherwise disappear.
Example Systems Integrated
When machine states, robot telemetry, WIP flow, cycle times, and alerts are connected, the layer can sort out whether the issue comes from equipment, scheduling, or staffing. That's a big deal because it helps teams act on the real cause instead of guessing.
With bottlenecks visible in real time, the next move is faster escalation when equipment, safety, or process issues show up.
4. Speed Up Incident Response and Safety Escalation
As throughput gets better, the next bottleneck is simple: how fast your team can react when something goes wrong.
The Operational Problem
When an incident hits the floor, response time often drags because safety, robot, and worker signals sit in different systems. Teams have to jump between tools, compare logs, and fill in gaps by hand. On top of that, fragmented factory data and opaque models can lead to uneven incident responses. By the time people figure out what happened, they've already lost time.
Signals Unified
A unified intelligence layer pulls together safety PLCs, robot emergency stop telemetry, access control systems, environmental monitors, and workforce management feeds. Instead of hunting through disconnected dashboards, operators can see the alert, the related telemetry, and the affected assets in one place.
That changes the job from searching for context to acting on it.
Primary KPI Affected
Track:
- MTTD
- MTTR
- Total incident response time
When detection and escalation move faster, teams can spend less time on triage and more time finding the root cause.
Example Systems Integrated
Start with safety PLCs, e-stops, access control, environmental monitors, and workforce management feeds. When those systems feed into one layer, safety teams get a clearer view of what happened and what needs to happen next.
This doesn't replace human judgment. It gives the right people the right context fast enough to act.
That same incident record also strengthens quality control.
5. Strengthen Quality Control with Unified Quality Data
Those incident records can double as quality records when the same defects keep showing up on the same machines, shifts, or operating conditions.
The Operational Problem
Quality defects get expensive fast when inspection data, process data, and operator input live in separate systems. A unified quality layer helps manufacturers catch repeat issues earlier and contain anomalies before they show up again.
The idea is simple: connect machine parameters, vision results, SPC data, and operator notes so teams can see what changed and respond sooner. That shared view also makes it easier to track FPY, scrap rate, rework rate, and COPQ without piecing together data by hand.
Signals Unified
A unified intelligence layer pulls together:
- Vision inspection results
- Robot telemetry
- Machine parameters
- Statistical Process Control (SPC) data
- Environmental readings like temperature and humidity
- Operator inputs
This matters because operator judgment should sit in the same record as machine data. If an operator makes a correction or flags a borderline issue, that input adds context machines alone can miss. Put it all in one place, and defect detection and root-cause analysis get much easier.
Example Systems Integrated
This layer often connects vision inspection platforms, MES, QMS, SCADA, robot controllers, and environmental monitors. That gives quality teams one record to review when defects appear, trigger alerts, and send high-risk anomalies to a reviewer before they recur.
A traceable record shows why a part was flagged and helps support audits.
That same shared context also makes human-in-the-loop review faster.
6. Support Human-in-the-Loop Interventions and Teleoperations
When automation can't make a safe call on its own, the next move is simple: send the case to a human.
Some situations still need a person to step in. That's especially true when the system runs into edge cases, unfamiliar conditions, or decisions tied to safety.
The Operational Problem
Automated systems are good at handling routine work. But they still need human review when something falls outside the norm or when the stakes are high.
Signals Unified
A unified intelligence layer pulls robot controllers, vision systems, PLCs, safety systems, MES, WMS, and alerts into one operator view. That means remote staff can inspect, diagnose, and intervene without bouncing between tools.
It also cuts out a common delay: waiting for local teams to piece together what happened. Remote operators can see the situation directly and act right away.
Primary KPI Affected
Primary KPI: throughput. Faster interventions help recover stalled work, cut downtime, and keep production moving.
Example Systems Integrated
HITL support connects robot controllers, vision systems, PLCs, safety systems, MES, WMS, and alerting tools, routing high-risk cases to a human reviewer.
Those interventions also create the records needed for better plant-wide decisions.
7. Turn Fragmented Factory Data into Clear Decision Support
Plant leaders usually have lots of data. What they often don't have is one shared record of what happened, why it happened, and what to do next. When that record lives in one place, it gives teams a much clearer base for faster, better plant decisions.
The Operational Problem
When context is scattered across systems, leaders burn time piecing events back together. They may see the output, but the decision trail is still fuzzy. A unified intelligence layer closes that gap by keeping the context tied to the event instead of making people rebuild the story every single time.
Signals Unified
A unified intelligence layer pulls MES, ERP, SCADA, WMS, QMS, and operator inputs into one shared record. Human corrections and review outcomes stay attached to each case, so the team builds a decision trail it can reuse later. That means operator corrections and expert judgment don't disappear after the moment passes - they become part of the shared record.
Primary KPI Affected
Primary KPIs include task completion time, response time, and productivity. Shared context helps teams review issues faster and cut down escalation cycle time.
Example Systems Integrated
Common inputs include:
- MES
- ERP
- SCADA
- WMS
- QMS
- operator records
Traceable decision layers help keep recommendations explainable for operators and auditors. And when decisions are stored in one place, teams can compare patterns across lines and sites.
8. Scale Continuous Improvement Across Sites and Workflows
Once you have a clear decision trail, the next move is simple in theory and hard in practice: turn that trail into a standard every plant can use.
Getting one line to run better is tough. Getting that same fix to stick across multiple plants is even tougher. A unified intelligence layer helps close that gap by turning local wins into repeatable standards.
The Operational Problem
The core problem usually isn't a shortage of ideas. It's that good results stay trapped in one place. One site figures something out, but another site ends up solving the same problem all over again.
Without a shared system for storing and repeating decisions, each plant keeps rebuilding the same answer from scratch. The goal is to make one working fix usable everywhere.
A unified intelligence layer treats the first successful result as a spec to be repeated, not a one-time win.
Signals Unified
For that to work, the system has to capture more than machine output alone. It also needs the operator choices that made the fix stick.
That means pulling in signals from across the factory, including:
- Robot telemetry
- PLC and machine states
- MES/WMS events
- Quality results
- Maintenance logs
- Worker activity
- Incident alerts
- Safety platforms
It also stores operator corrections and supervisor decisions as standards other sites can reuse. In plain terms, the human side of the fix becomes part of the shared record too. That's a big deal, because other plants can learn from what people did, not just what the machines reported.
Primary KPI Affected
The main manufacturing KPI affected here is OEE (Overall Equipment Effectiveness).
When improvement logic is shared across sites, each facility gets more than its own past experience. It gets the lessons learned across the whole network. That can help teams move faster and avoid the usual trial-and-error loop.
Example Systems Integrated
The systems feeding this kind of improvement loop often include robots, PLCs, SCADA, MES, CMMS, WMS, quality systems, and safety platforms.
When those systems feed into one shared layer, proven fixes can move from one line to another, and from one site to the next. A new plant doesn't have to start from zero. It starts with tested standards instead of a blank slate.
That shared playbook is what lets the stack execute improvements in a consistent way across the operation.
How evlo.ai Fits into the Unified Intelligence Stack

A unified layer only matters if it learns from what actually happens on the factory floor. evlo.ai turns that unified intelligence layer into an operational stack built around the problems factories deal with every day: downtime, visibility, response speed, and repeatable improvement.
Phase 1 starts with the data foundation. The system records human expert corrections, judgments, and decisions as training data. When expert judgment lives inside the same system, future responses become faster and more consistent.
Phase 2 moves into robotic teleoperations and fleet monitoring. Remote operators step in during edge cases and safety-critical exceptions. Those intervention records then become part of the same operational memory the factory uses to improve later decisions. In plain terms, operator action feeds a tighter loop for system improvement.
Phase 3 is the Manufacturing Brain. This is where reused learning starts to compound across sites. When the system handles a complex situation, it stores that approach so other facilities can use it without starting from scratch. Reused decisions cut rework, shorten recovery time, and standardize fixes across sites.
The stack works because each event makes the next decision better. That’s how the impact shows up in measurable ways across downtime, throughput, quality, and response time.
Operational Impact at a Glance
Each of the eight benefits in this article ties back to clear signals, connected systems, and KPIs you can track. The table below puts those eight operational gains in one place.
| Benefit | Signals Unified | Systems Connected | KPI Improved | Example Outcome |
|---|---|---|---|---|
| 1. Predictive Maintenance | Vibration, temperature, power draw, cycle counts | SCADA, PLC, CMMS | Unplanned downtime | Detects failure patterns sooner. |
| 2. Robot Fleet Visibility | Robot telemetry, fault codes, utilization trends | Fleet and production systems | Fleet uptime, idle time | Teams spot stoppages sooner. |
| 3. Throughput & Bottleneck Removal | Cycle time data, WIP levels, conveyor speeds, station queue depth | MES, line controls, OEE systems | OEE, units per shift | Bottlenecks are easier to isolate. |
| 4. Incident Response & Safety | Safety sensor triggers, worker proximity alerts, emergency stop logs | Alerting and control systems | Mean time to respond | Alerts reach responders faster. |
| 5. Quality Control | Vision system outputs, SPC data, defect codes, rework logs | QMS, vision inspection, MES | Scrap rate, first-pass yield | Defects surface earlier and trace faster. |
| 6. Human-in-the-Loop Interventions | Operator corrections, exception cases, expert approvals | Teleoperation console, robot controllers, safety systems | Response time, intervention quality | Experts resolve edge cases without stopping production. |
| 7. Decision Support | MES records, maintenance logs, shift notes, operator comments | MES, ERP, CMMS, QMS | Task completion time, decision latency | Teams act on one shared record instead of reconciling multiple systems. |
| 8. Continuous Improvement | Standard work, fix history, approved workarounds, lessons learned | Knowledge base, MES, CMMS, training system | Changeover time, repeat incident rate, OEE | Proven fixes spread across lines and sites. |
Taken together, these links turn isolated factory signals into a single operating loop.
Conclusion
A unified intelligence layer isn't just a reporting layer - it's a shift in how the factory runs day to day. It connects signals to action. And when you put those pieces together, factories can respond in the moment and get better over time. By linking telemetry, workflows, quality, and alerts, the layer gives teams one clear operating view.
In plain terms, that means less downtime, better fleet visibility, higher throughput, faster escalation, tighter quality control, stronger human-in-the-loop control, better decisions, and repeatable gains across sites.
Instead of making operators stitch together information from separate systems, the layer brings the right context to the right operator at the right time. That's where factory data starts to become an operating edge. Human expertise helps train the system, which improves future decisions and day-to-day execution. Manufacturers that adopt this model don't just gain visibility - they run safer floors, more efficient lines, and a culture of continuous improvement.
FAQs
What is a unified intelligence layer?
A unified intelligence layer is a digital setup that pulls disconnected data from across a manufacturing facility into one shared framework.
It connects robot telemetry, machine sensor data, worker activity logs, production workflows, and operational alerts to give teams real-time visibility and action-focused decision support. That helps manufacturers break down data silos, improve predictive maintenance, optimize throughput, and strengthen safety.
Which factory systems should be connected first?
Start with machine data and robot telemetry to set a clear baseline for equipment health and performance. Then layer in production workflows and operational alerts so teams can coordinate in real time.
From there, add worker activity data to fill in the missing context. This phased setup creates a fast feedback loop that supports predictive maintenance and sharper incident response across the factory floor.
How do manufacturers measure ROI?
Manufacturers measure ROI by tracking day-to-day gains from a unified intelligence layer that connects factory data that used to sit in separate systems. When robot telemetry, machine data, and workflow alerts come together in one place, teams can put numbers behind improvements in efficiency, safety, and scale.
That also makes the financial impact much easier to track. Think lower downtime from predictive maintenance, better throughput, and faster incident response.