Your Factory Is Drowning in Data - Here's How to Turn It Into Intelligence

Leela Yanamaddi
August 3, 2026
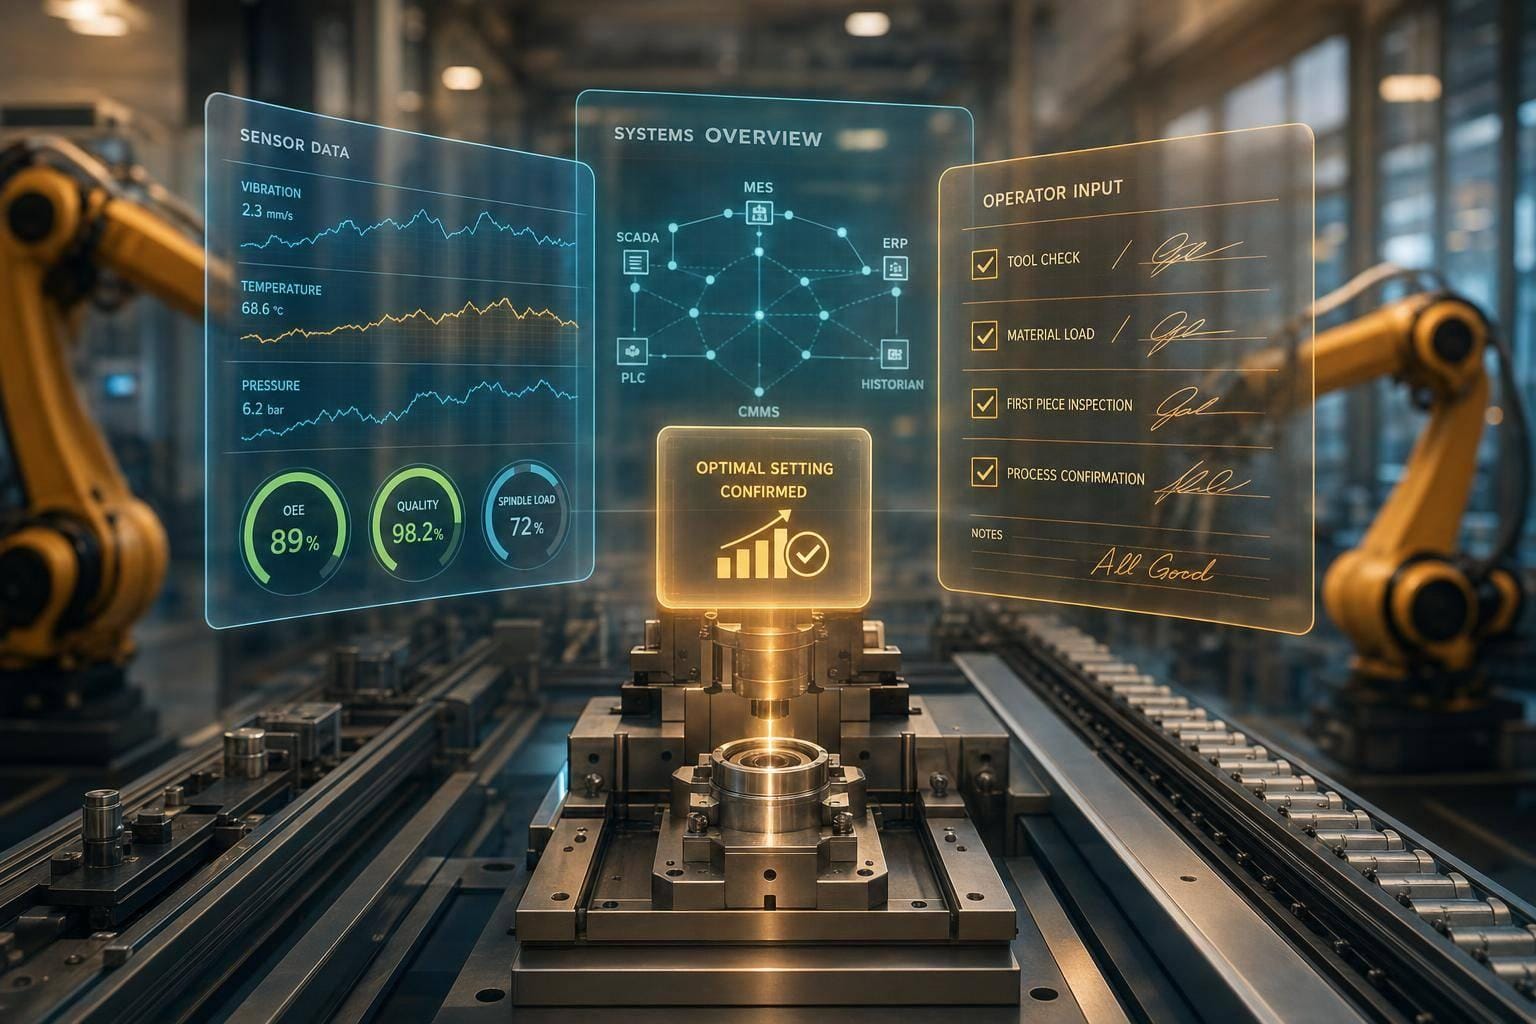
Factories don’t have a data shortage. They have a context shortage. U.S. manufacturing creates about 1.9 petabytes of data per year, yet much of it never helps someone make a decision. I’d fix that by putting machine data, business system data, and worker input into one shared layer, then using shared IDs, clean timestamps, and clear rules to turn raw signals into alerts, root-cause views, and prediction.
If I had to sum up the article in plain English, it comes down to this:
- Too much data sits in silos like PLCs, MES, ERP, historians, and paper logs
- More data does not mean better decisions if no one knows the work order, shift, asset, or machine state behind it
- One shared data layer helps teams see the same version of what is happening
- Three data layers matter: raw, standardized, and decision-ready
- Shared IDs and metadata make cross-system analysis work
- The first outputs should be useful right away: alerts, root-cause analysis, maintenance prediction, and production planning support
- The best rollout starts small with one line, one problem, and one use case
- A practical timeline is about 90 days for first dashboards, 180 days for the first predictive use case, and 365 days for rollout across sites
Here’s the short version of the article’s main point: if your teams still wait for end-of-shift reports, chase downtime after the fact, or argue over which dashboard is right, the problem is not lack of data. It’s lack of a shared structure around that data. That is what turns noise into answers.
| Problem | What I’d do |
|---|---|
| Data spread across PLCs, ERP, MES, and spreadsheets | Put it into one shared layer |
| Sensor data with no business context | Link it to work orders, shifts, lots, and assets |
Mismatched names like Line_04 vs. L4 |
Use one common asset ID |
| Delayed reports | Use live streams and event-based alerts |
| AI projects that stall | Clean up IDs, timestamps, and metadata first |
Bottom line: I’d stop treating factory data like a storage problem and start treating it like a context problem. Once the data is connected and labeled the same way across systems, it can support faster decisions, lower downtime, better quality, and tighter labor use.
The Core Problem: Factory Data Is Fragmented, Delayed, and Hard to Trust
Where Factory Data Lives Today
The problem starts with where the data lives. In a typical U.S. plant, data is spread across many systems that don't talk to each other. And each one answers a different shop-floor question.
PLCs produce machine signals such as motor states, valve positions, and cycle times. Industrial historians store high-frequency process data, but pulling that data out often means dealing with specialized connectors or SQL queries. MES and ERP systems store production orders, downtime codes, and inventory levels, often inside legacy databases with weak documentation.
Then there's the human side, and that part matters just as much. Operator observations, cycle times, and line interruptions are still often written on paper clipboards or entered at the end of a shift. That creates delays in decision-making. By the time those notes show up, the current run is usually over.
Sensors can tell you what happened. A person can tell you why. Maybe the raw material was wet. Maybe a setup changed mid-run. If that context never gets entered into a digital system, it's lost.
What Disconnected Systems Cost You
When these systems stay separate, small issues pile up fast. A vibration reading on a press might point to an anomaly. But without the active work order, the operator, and the machine state tied to it, you may not know whether you're looking at a true failure or a planned condition during a certain run.
That gray area burns time. And in manufacturing, time turns into cost almost immediately.
You see it in the numbers that plant teams care about every day: lower throughput, more scrap, unplanned downtime, and poor labor calls. Maintenance becomes reactive instead of predictive. Overtime gets approved based on shift reports that are already stale .
The naming mess makes it worse. One system says "Line_04." Another says "L4." Sounds minor, right? It isn't. Even simple KPI math like OEE can turn into an argument because departments are working from different labels, units, and assumptions.
That's one big reason manufacturing AI projects stall. The models aren't always the problem. The missing piece is a single factory intelligence layer that puts machine data, business data, and operator context in the same place.
Legacy Silos vs. a Unified Factory Intelligence Layer
| Dimension | Siloed Historians & Manual Reporting | Unified Factory Intelligence Layer |
|---|---|---|
| Data Access | Fragmented across PLCs, ERP, and spreadsheets | Centralized via a Unified Namespace (UNS) or data lakehouse |
| Real-Time Visibility | Delayed (hourly or daily); issues surface after the shift ends | Sub-second visibility |
| Root-Cause Speed | Days | Minutes, not days |
| Governance | Inconsistent naming conventions and units across systems | Standardized naming, units, and automated data quality checks |
| Scalability | Brittle; every new machine needs a custom point-to-point link | New assets plug into the existing hierarchy and publish to the broker |
This isn't just an IT headache. It's a plant-floor problem.
When a line stops at 2:00 a.m., the team on call doesn't need more raw data sitting in separate tools. They need to know what happened, which asset was involved, which work order was running, and who was on the machine. A unified layer gives them that answer in minutes instead of the next morning.
That's the line between collecting data and using it.
AI-Powered Smart Factory | How Artificial Intelligence is Transforming Modern Manufacturing | Uplatz

The Solution: Build One Manufacturing Intelligence Layer
To fix factory data that's split across systems, late, or hard to trust, build one manufacturing intelligence layer. The idea is simple: connect machines, MES, ERP, quality systems, and operator logs in one place.
That means linking OT signals with IT systems inside one shared structure.
Connect OT and IT Data Into a Central Store
On the OT side, pull real-time telemetry from PLCs, CNCs, and sensors using industrial protocols like OPC UA and MQTT Sparkplug B. Then connect MES, ERP, and CMMS through APIs or SQL so you can bring in work orders, BOMs, and maintenance schedules.
For legacy equipment that doesn't have native outputs, use IoT gateways or computer vision to capture signals without replacing the machine.
Once those systems are connected, every source can publish to a Unified Namespace (UNS) set up as Site → Area → Line → Asset. Dashboards, models, and alerts can then read from one shared stream instead of a pile of machine-by-machine links. That cuts out the point-to-point integration mess.
After the stream is unified, the next step is to sort it into layers people can use.
Organize Data Into Raw, Standardized, and KPI-Ready Layers
Not all data is ready to use the second it shows up. A practical intelligence layer sorts data into three tiers, and each one has a different job.
| Layer | What It Contains | What It's Used For |
|---|---|---|
| Raw | Sub-second PLC tags, sensor signals, ERP transactions | Preserving original source data exactly as captured |
| Standardized | Normalized units, synced timestamps, ISA-95 mapped assets | Making data from different vendors comparable and searchable |
| Decision-Ready | Aggregated OEE, MTBF, scrap rates, energy use, labor efficiency | Supporting operational and leadership decisions by role |
The standardized layer turns a tag like PLC_Tag_101 into a name a person can read, adds the right unit of measure, and lines it up with a shared asset hierarchy. That way, a maintenance lead and a plant manager can look at the same metric and trust it.
The decision-ready layer is where the business side starts to show up. It rolls enriched data into hourly and daily views by station and by factory. Those views support the questions teams ask every day:
- Is this line running well?
- When is this asset likely to fail?
- Where is scrap coming from?
Set Shared IDs, Metadata, and Access Rules
Without one stable asset ID across the PLC, ERP, and CMMS, cross-system analysis falls apart. A Canonical Asset Master fixes that. It's a single reference table that maps each system's ID to one common identifier.
The same goes for Work Order, Product/SKU, Lot, Worker ID, and Shift. These need shared identifiers before OT data can be joined with business data. If that mapping isn't in place, OEE, downtime tracking, and root-cause analysis stay shaky.
Each data point should also carry metadata the moment it's created: units, timestamp, machine state, and the work order tied to it. ERP clocks can drift by minutes compared with sub-second PLC clocks, so normalizing everything to UTC at ingest helps prevent silent downstream errors.
Role-based access control (RBAC) decides who can see what. In plain English, each team gets the view it needs. A maintenance lead needs asset health and failure history. A plant manager needs throughput and OEE.
With the data layer unified and governed, it can power alerts, root-cause analysis, and predictive actions.
Intelligence Outputs Leaders Can Act On Right Away
A unified data layer matters only if people can use what it produces. The job is simple: turn raw signals into alerts, diagnosis, and action. Once data is connected, the next move is to shape it into outputs operators and leaders can use on the spot. Those outputs should help with throughput, quality, downtime, and labor efficiency.
Real-Time Alerts and Production Monitoring
The first output a factory intelligence layer should deliver is visibility into what’s happening right now. That means threshold-based event rules that watch for cycle-time drift, line stoppages, temperature spikes, and queue buildup, then trigger alerts in real time.
Some signals need instant action. A robot fault or an unexpected line stop should fire at the edge, where response happens in milliseconds. Other signals play out over more time. Energy use creeping upward or bearing temperature slowly rising makes more sense for cloud analysis. Split the work this way, and alerts stay fast and useful instead of burying supervisors in noise.
There’s also a part people often miss: the data pipeline itself needs monitoring. If a PLC connection fails quietly, a factory can lose hours of analytical context before anyone spots the problem. Every source should have a clear health state and send an alert if it stops reporting.
That gives leaders the live signal layer they need before stepping into diagnosis and prediction.
Root-Cause Analysis and Predictive Maintenance
Real-time monitoring tells you what happened. Root-cause analysis tells you why. That difference is a big deal. The same symptom, like a spike in defects or downtime, might trace back to a material lot, a shift, or a machine state that changed overnight. Sensors by themselves can’t sort that out.
Context is what makes a signal useful instead of misleading. A vibration reading, on its own, doesn’t say much without the product, shift, and machine state tied to it. When that context is attached at the moment of capture and linked to work order, worker, and machine-state IDs, an AI model can begin telling the difference between a changeover and a failure. That only works when machine, work-order, and worker data all use the same IDs. That’s the base for predictive maintenance that works in practice. Research shows AI-powered predictive maintenance can cut unplanned downtime by as much as 47%.
Mapping Data Sources to Decisions
Each decision needs a different mix of data. The table below shows how the four main intelligence outputs connect to the data behind them, the analysis used, and the shop-floor decisions they support.
| Intelligence Output | Required Data Sources | Analytics Method | Operational Decisions Supported |
|---|---|---|---|
| Real-Time Monitoring | PLC tags, IIoT sensors (temp, vibration), energy meters | Threshold-based event rules, edge processing | Immediate maintenance dispatch; shift-level labor reallocation |
| Root-Cause Analysis | SCADA events, MES work orders, operator logs, quality results | Correlation of machine states with human/process context | Process parameter adjustments; targeted operator training |
| Predictive Maintenance | Historical failure logs, sensor trends (vibration/current), MRO inventory | ML-based failure signature detection, anomaly detection | Scheduling repairs during planned downtime; spare parts procurement |
| Production Optimization | ERP demand, MES job status, SCADA actual cycle times | Constraint-based AI, bottleneck analysis | Dynamic rescheduling; adjusting line speeds to meet customer commitments |
When actual cycle times feed planning data, leaders can reschedule before missed orders start piling up. A smart way to roll this out is to start with one line, show the value, and then extend the same outputs across the plant.
How to Roll It Out: Start Small, Prove Value, Then Expand
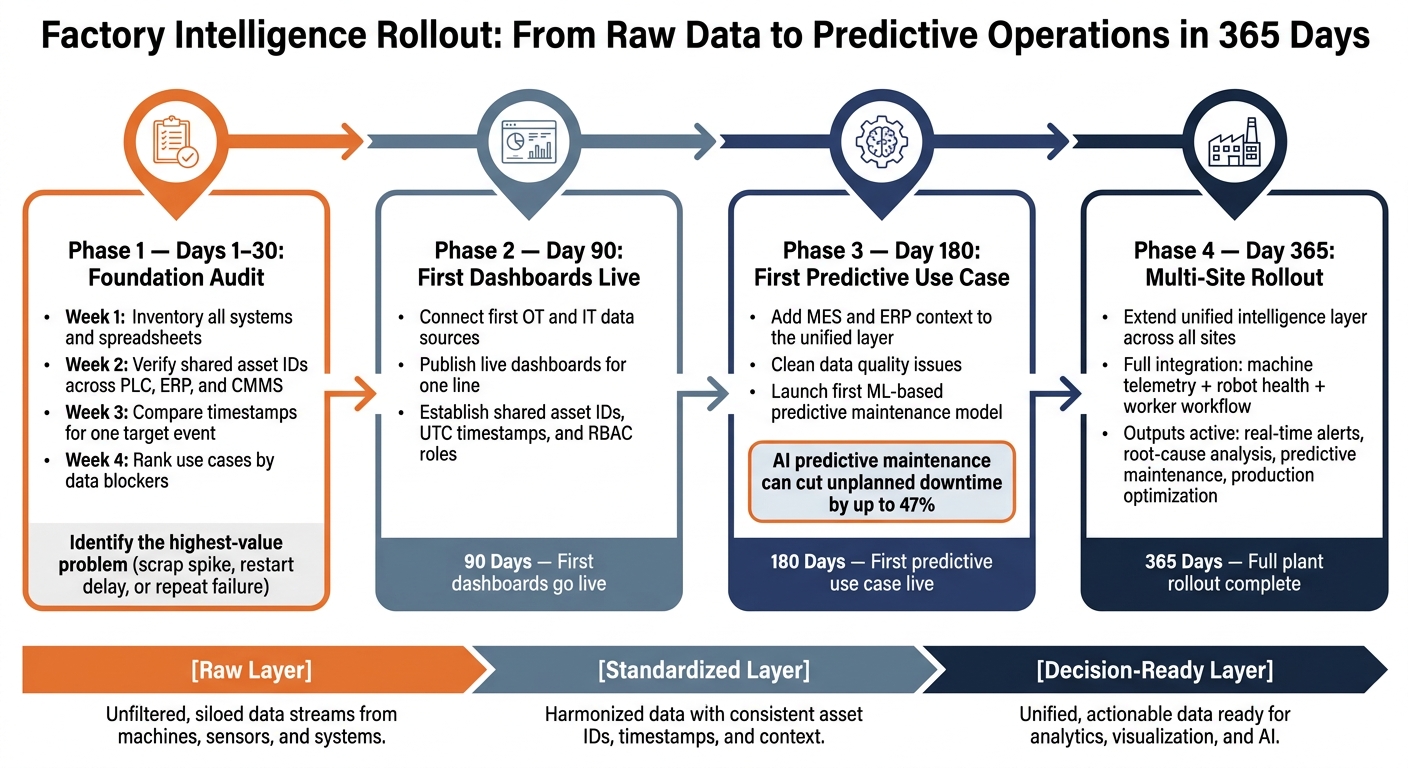
Factory Intelligence Rollout: From Raw Data to Predictive Operations in 365 Days
Once alerts and root-cause views are in place, the next step is scale. But this is where a lot of teams trip up. If you try to roll out every machine at the same time, costs climb fast and integrations get messy. A better move is to start with one high-value use case, connect only the data needed for that case, and prove it works before going broader.
Phase 1: Start With the Highest-Value Data First
Begin with the one problem that causes the most pain: a restart delay, a scrap spike, or a repeat asset failure. Then pull in only the ERP, MES, and SCADA data needed to explain that issue.
A simple 30-day foundation audit keeps the work focused:
- Week 1: inventory systems and spreadsheets
- Week 2: verify shared asset IDs
- Week 3: compare timestamps for one event
- Week 4: rank use cases by data blockers
For older equipment, you don't need to rip out the control system. Use IoT gateways to capture PLC signals, or give operators a simple app to log cycle starts and stops.
Before you expand, check three things: shared IDs, timestamps, and ownership. That short list gives you the backlog for the first predictive use case.
Phase 2: Move From Dashboards to Predictive Actions
Once the first use case is stable, the job changes. Now it's about moving from dashboards to predictive actions. In plain terms, that means adding MES and ERP context, cleaning up data quality, and launching the first predictive use case.
A realistic timeline looks like this: 90 days to connect the first data sources and publish dashboards, 180 days to launch the first predictive use case, and 365 days to roll it out across sites.
At this point, the unified intelligence layer should bring together machine telemetry, robot health, and worker workflow data. That gives the plant one view for monitoring operations, predicting failures, and guiding decisions.
Conclusion: The Direct Path From Raw Data to Factory Intelligence
The path is straightforward: identify the highest-value data, connect OT and IT without disrupting production, standardize context, and move from alerts to prediction. The aim is faster, safer, and more reliable operations.
FAQs
Where should a factory start first?
Start with architecture, not new tools. If your data is scattered across systems, adding analytics on top usually makes the mess worse.
First, audit your current data flow. Map out where information lives, how it moves, and where it gets stuck. That gives you a clear view of what you're working with instead of piling on more software and hoping it sorts itself out.
Next, pick one painful, measurable business problem to solve, like cutting scrap or reducing downtime. Keep the scope tight. Then figure out the minimum data you need to address that problem, and bring those sources together under a structured architecture such as a Unified Namespace before you scale or roll out advanced AI models.
What data needs to be standardized?
Standardize the basics that let systems communicate and help AI make sense of day-to-day operations:
- Naming and hierarchy for sites, areas, lines, and machines
- Time synchronization across devices
- Context and taxonomy for parts, lots, downtime, defects, and KPIs
- Data modeling that adds business context, such as worker IDs, work orders, and machine states
This gives every system the same operational view. Instead of one machine calling something “Line 1” and another calling it “L1,” everyone works from the same playbook. The same goes for timestamps, part labels, downtime codes, and job data.
That shared structure matters more than it may seem. If the basics are messy, AI has to guess what the data means. And guesswork is where bad analysis starts.
How do you connect legacy machines?
You usually don’t need to replace legacy equipment. In many cases, it’s enough to add a digital layer that collects and streams data.
A common setup uses IoT gateways tied to legacy PLCs. These gateways take proprietary signals and translate them into standard protocols like MQTT or OPC-UA. That lets older machines feed data into the same flow as newer systems without a full rip-and-replace project.
If a machine doesn’t have a data port, there are still ways to pull in data. You can use computer vision to read analog gauges and light towers, or rely on app-based operator inputs for manual updates.
Once collected, that data can be normalized in a Unified Namespace right alongside data from modern systems.