Teleoperation Cost per Demonstration: A Breakdown

Leela Yanamaddi
September 29, 2026
What you pay for is not a recorded trial. It’s a demo that passes QA and is ready for training.
If you spend $600.00 in a shift and only 6 demos pass, your cost is $100.00 per accepted demo. Not $75.00 per trial. That gap is where many teams miss the true price of data collection.
Here’s the short version:
- Use accepted demos in the denominator, not total recordings
- Count every session cost in the numerator: labor, robot time, QA, software, recovery, and overhead
- Throughput drives cost:
accepted demos/hour = attempts/hour × acceptance rate - A drop in acceptance rate from 90% to 70% can increase unit cost by about 28.6%
- The big cost levers are usually:
- rejection rate
- reset time
- utilization
- recovery time
- hourly station cost
I’d sum up the article like this: if you want a clean budget for teleoperation, track fully loaded cost per accepted demonstration. That one number tells you what training-ready data actually costs, whether you’re running a manipulation station, a warehouse robot, or a humanoid setup. This data is the foundation for Physical AI in manufacturing, enabling machines to handle variable production tasks.
A few examples from the article make the point fast:
- Manipulation: $7.78 per accepted demo
- Warehouse: $15.55 per accepted demo
- Humanoid: $83.57 per accepted demo
Quick Comparison
| Workflow | Accepted Demos | Session Cost | Cost per Accepted Demo | Main Cost Pressure |
|---|---|---|---|---|
| Manipulation | 92 | $716.00 | $7.78 | resets, QA, calibration |
| Warehouse | 60 | $933.00 | $15.55 | travel, waiting, spotter time |
| Humanoid | 28 | $2,340.00 | $83.57 | safety staff, recovery, specialist labor |
Bottom line: if you only track cost per hour or cost per attempt, you can understate what usable robot data costs. The article shows how to calculate the number that matters, what to include, and which inputs move it the most.
The Cost Components Behind Every Demonstration
To get the fully loaded cost right, break it into the line items below. These are session-level costs that you’ll later divide by accepted demos.
The table shows how each cost moves and where it belongs.
| Cost Line Item | Cost Behavior | Allocation Basis |
|---|---|---|
| Operator wages and payroll burden | Variable | per operator-hour |
| Supervisor or safety monitor | Mixed | per station-hour |
| Robot depreciation or lease | Fixed/mixed | per robot-hour |
| Maintenance and consumables | Variable/mixed | per robot-hour |
| Networking, video streaming, and edge compute | Variable | per station-hour |
| Storage and dataset packaging | Variable | per accepted demo |
| QA review | Variable | per demo reviewed |
| Facility and program overhead | Fixed/mixed | per station-hour |
Labor, Supervision, and Safety Coverage
In the U.S., skilled teleoperation labor usually lands between $35–$65 per hour fully burdened. On top of that, onboarding often adds $1,000–$3,000 per operator, and that cost should be spread across the output you expect from each operator.
Supervision works differently. If a safety monitor covers four similar stations and costs $60 per hour, that comes out to $15 per station-hour. But that math falls apart if the task needs close physical presence or frequent intervention. In that case, the monitor may need to stay with one station, which pushes the full $60 per station-hour into the model.
That includes more than just standing nearby. Preflight checks, emergency-stop verification, live monitoring, incident documentation, and post-session review all count. If supervision looks too cheap on paper, there’s a good chance the cost per accepted demo is being understated.
Robot Time, Connectivity, and Software Infrastructure
Robot cost goes past plain depreciation. A full station includes the robot, end effector, sensors, safety gear, and dedicated compute. If a station costs $150,000 and delivers 6,000 usable hours, depreciation alone is $25 per station-hour. Add $8 per hour for upkeep, and a 20-minute demo carries $11.00 in hardware cost alone before any operator logs in.
Then come networking, video streaming, and edge compute. Network transport, remote-access security, session management, synchronization, logging, and dataset packaging do not all scale the same way. Streaming and compute tend to follow station-hours. Storage and packaging tend to follow data volume and accepted output.
A 15-minute episode recorded across three cameras at 30 fps can generate about 2 GB of raw data. At scale, 10,000 such episodes can produce about 8 TB of raw video. And that’s just the start. Storage math should also cover derived streams, QA artifacts, backups, and rejected attempts, not only the final trajectory. At that point, storage, transfer, and preprocessing stop looking small.
QA, Failure Recovery, and Shared Overhead
QA spend should be allocated across accepted demos, since rejected sessions are already baked into the denominator. Automated checks handle episode completeness, timestamp sync, joint-limit violations, and frame drops. Human review covers task-success verification, metadata completeness, and outlier trajectories.
Reported industry guidance suggests that 15%–25% of demonstrations may need to be flagged or rejected in high-quality collection programs.
Failures make costs climb fast because they burn three things at once:
- operator time
- technician time
- station time
If failures repeat, downtime piles up too. That’s why recovery should sit in the budget as its own line item, not get buried in a rough estimate. Shared overhead, such as facility rent, utilities, insurance, engineering support, and program management, should be assigned by station-hour or accepted demo based on whether the cost is tied to capacity or output.
Use these line items as the inputs for the session-level cost calculation in the next section.
How to Calculate Cost per Accepted Demo Correctly
Use the session-level formula below to turn logged costs into accepted-demo cost:
Cost per accepted demo = Fully loaded collection cost for the session ÷ Number of accepted demos
The hard part isn't the math. It's making sure the numerator includes every session cost and that each cost is assigned to the right session.
A Step-by-Step Workflow for Session-Level Costing
Use this workflow to turn the cost buckets from the previous section into one session-level number.
- Define the accepted-demo boundary in writing before the session starts. Set one written boundary for what counts as accepted: start command, task completion, metadata validation, and QC approval.
- Record time in separate buckets. Log setup, active teleoperation, reset, recovery, QA, and inactive paid time on their own. Reset often takes 10%–30% of a session.
- Count attempts and outcomes separately. Track total attempts, successful attempts, rejected attempts with reason codes, invalidated sessions, and final accepted demos. Those rejection reasons matter. Operator error, hardware fault, sync failure, and missing metadata each point to a different fix.
- Assign direct costs to the session. Multiply labor hours by fully loaded hourly rates. Then add robot time, connectivity, software, storage, and consumables. Include failure recovery time in the numerator. Don't bury it inside the acceptance rate.
- Allocate shared costs with a consistent basis. Assign station depreciation and facility costs by station-hour, software and storage by episode count or data volume, and engineering support by project hours.
- Divide by accepted demos. Then report three supporting metrics next to the result: acceptance rate, attempts per hour, and accepted demos per hour. Those three numbers show whether cost is coming from cycle time, rejection rate, or both.
After that, reconcile the result against payroll, robot logs, software usage, storage, and QA records. If the numbers don't line up, there's a good chance some overhead is missing.
The Throughput Equation That Changes the Result
Once session costs are logged, throughput decides how many accepted demos each hour can carry.
Accepted demos per hour is the key driver here. It combines two variables:
Accepted demos/hour = Attempts per hour × Acceptance rate
Attempts per hour depends on demo length plus reset time. In spreadsheet form:
Attempts/hour = 60 ÷ (average demo duration + reset time)
Here's a simple example. If an operator makes 24 attempts in a two-hour session and 18 are accepted:
- Attempts per hour = 12
- Acceptance rate = 75%
- Accepted demos per hour = 9
If the fully loaded station costs $120 per collection hour, the cost per accepted demo is $13.33.
Now look at what happens when acceptance rate slips. A drop from 90% to 70% increases cost per accepted demo by about 28.6%, assuming hourly cost and raw attempt rate stay the same. That's a big budget swing from one process variable.
More attempts per hour don't always mean lower cost. If acceptance falls, the same hourly spend can lead to very different per-demo costs:
| Workflow | Attempts/Hour | Acceptance Rate | Accepted Demos/Hour | Cost per Accepted Demo |
|---|---|---|---|---|
| Fast, failure-prone | 20 | 50% | 10 | $10.00 |
| Slower, reliable | 14 | 90% | 12.6 | $7.94 |
The slower workflow ends up cheaper per accepted demo even with fewer raw attempts. And if failures add recovery time, the gap gets even larger.
For planning, use accepted demos per fully loaded station hour for budget forecasts.
Planning Examples Across 3 Common Robotics Workflows
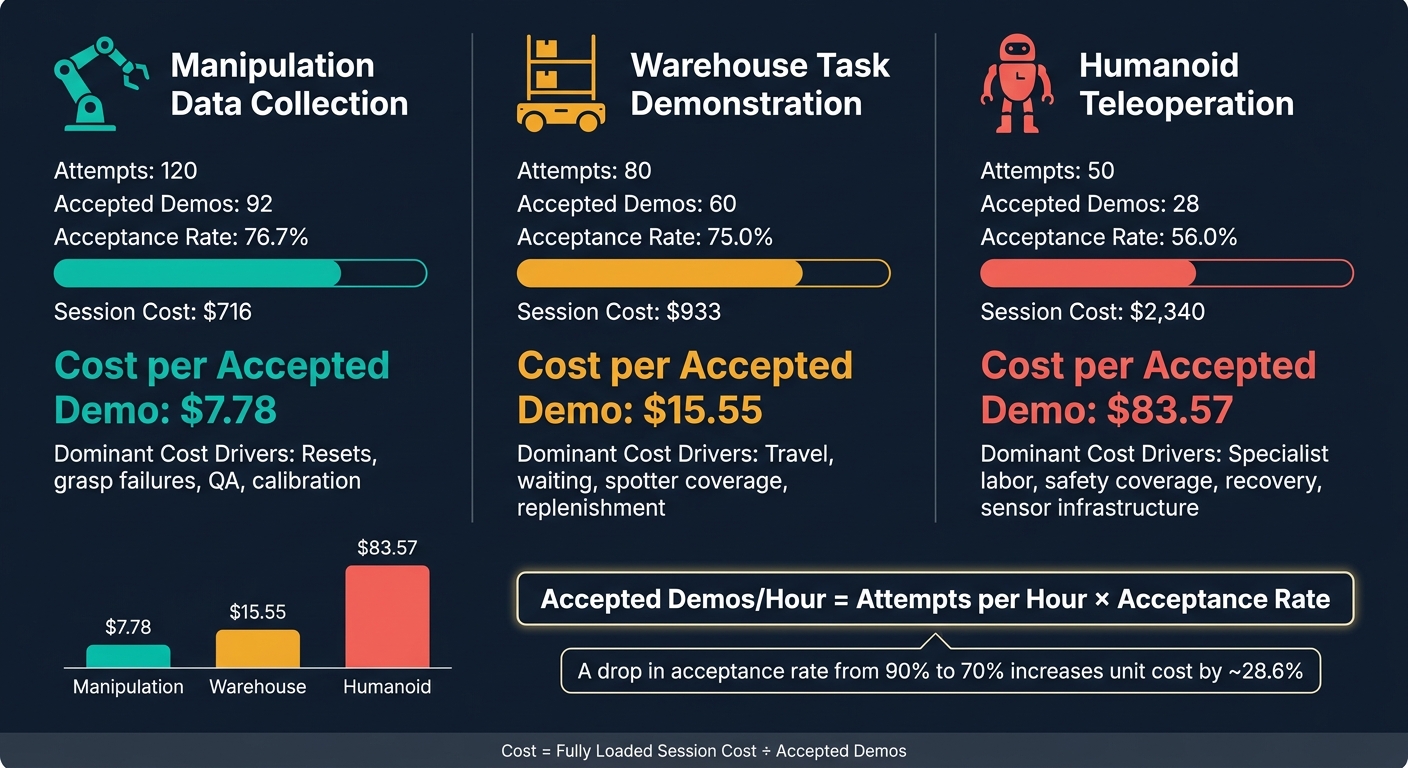
Teleoperation Cost per Accepted Demo: 3 Robotics Workflows Compared
These examples apply the throughput equation to three common workflows. Here, an accepted demo means a complete episode that passes both task checks and QA. Treat these as planning templates, not benchmarks. The point is simple: the same equation can look very different depending on the robotics workflow.
Manipulation Data Collection Example
Take a 6-hour single-arm or bimanual collection session and convert wall-clock time into accepted-demo cost. Assume 120 attempted episodes at about 3 minutes each, a 90% task-completion rate, and 85% acceptance among completed episodes. That works out to about 92 accepted demonstrations.
Now add the time that usually gets missed in rough planning: 60 minutes for object resets and scene prep, 30 minutes for camera and robot calibration, and 30 minutes for review or relabeling.
| Line Item | Assumption | Cost |
|---|---|---|
| Operator labor | 8 total hours × $30/hour | $240 |
| QA reviewer | 1.5 hours × $45/hour | $68 |
| Robot and station time | 6.5 hours × $40/hour | $260 |
| Software, storage, and connectivity | 6.5 hours × $15/hour | $98 |
| Consumables and object replacement | Planning allowance | $50 |
| Total | $716 |
Cost per accepted demo: $7.78. The biggest swing factor here is acceptance rate. If the total session cost stays at $716, then 70 accepted demos pushes unit cost up to $10.23. If the session gets to 110 accepted demos, unit cost falls to $6.51. That is a $3.72 swing driven only by acceptance rate, not by any change in robot or labor spend.
Before any episode gets counted as accepted, flag timestamp misalignment, missing frames, blur, action-range violations, and file-integrity issues. That step matters. Published manipulation research shows that real-robot collection sessions can involve both a teleoperator and an assistant for scene reset, object placement, safety supervision, and recovery - costs that disappear if you count only active control time.
Warehouse teleoperation shifts the budget in a different direction. Travel, waiting, and spotter coverage start to eat up the day.
Warehouse Task Demonstration Example
Model a mobile manipulator collecting tote-handling demonstrations during a 6-hour operating window, then convert that window into accepted-demo cost. Assume 80 attempted task demonstrations, with 60 accepted after accounting for navigation interruptions, inventory issues, operator corrections, and QA review.
It helps to separate active teleoperation from everything around it. Out of the 6 hours, about 4 are active teleoperation. The rest goes to travel, waiting, replenishment, and spotter coverage.
The model should record aisle closures, shared-warehouse scheduling, travel distance, tote availability, pallet or inventory replenishment, and whether a spotter has to stay present.
| Line Item | Assumption | Cost |
|---|---|---|
| Teleoperator labor | 6 hours × $30/hour | $180 |
| Spotter or safety coverage | 3 hours × $35/hour | $105 |
| Supervisor allocation | 1 hour × $45/hour | $45 |
| Robot and facility time | 6 hours × $55/hour | $330 |
| Connectivity and software | 6 hours × $18/hour | $108 |
| QA and labeling | 2 hours × $45/hour | $90 |
| Replenishment and delay allowance | Planning allowance | $75 |
| Total | $933 |
Cost per accepted demo: $15.55. Travel and waiting do most of the damage to the budget. A disruption-heavy shift that drops accepted demos to 42 pushes unit cost to about $22. Labor rates did not change. Robot rates did not change. The denominator just collapsed.
Humanoid teleoperation pushes that same pattern even harder, with specialist labor and safety coverage taking over the budget.
Humanoid Teleoperation Example
Assume a 7-hour block with 1 hour of preparation, 5 hours of active collection, and 1 hour of recovery, review, and handoff. Then convert that block into accepted-demo cost. Assume 50 attempted demonstrations, a 70% task-success rate, and 80% acceptance among successful episodes. That yields 28 accepted demonstrations.
This model should include motion-capture or VR gear, multistream sensing, safety staff, fall recovery, hardware checks, and operator breaks.
| Line Item | Assumption | Cost |
|---|---|---|
| Specialized operator labor | 8 hours × $45/hour | $360 |
| Safety operator or spotter | 7 hours × $40/hour | $280 |
| Supervisor and review | 2 hours × $60/hour | $120 |
| Robot, capture, and facility time | 7 hours × $150/hour | $1,050 |
| Software, storage, and connectivity | 7 hours × $40/hour | $280 |
| Recovery, inspection, and consumables | Planning allowance | $250 |
| Total | $2,340 |
Cost per accepted demo: $83.57. Complex humanoid collection often runs at 1–3 demos/hour, with 3–8 minute episodes. Here, safety, recovery, and specialist labor drive the budget more than the robot’s purchase price. Track completion time, error rate, and trajectory smoothness by session window. If failure rates start climbing, that usually points to a need for breaks, operator rotation, or shorter sessions.
Here’s the side-by-side view:
| Workflow | Attempts | Accepted Demos | Acceptance Rate | Session Cost | Cost per Accepted Demo | Dominant Cost Drivers |
|---|---|---|---|---|---|---|
| Manipulation data collection | 120 | 92 | 76.7% | $716 | $7.78 | Resets, grasp failures, QA, calibration |
| Warehouse task demonstration | 80 | 60 | 75.0% | $933 | $15.55 | Travel, waiting, spotter coverage, replenishment |
| Humanoid teleoperation | 50 | 28 | 56.0% | $2,340 | $83.57 | Specialist labor, safety coverage, recovery, sensor infrastructure |
Do not compare these figures directly unless task definitions, session length, and acceptance criteria match. For cross-workflow comparison, use accepted demos per wall-clock hour. A low per-demo cost can still hide weak throughput or thin data diversity.
The Biggest Cost Levers and a Budgeting Template
The examples above show what teleoperation costs. This section focuses on the operating choices that push that number up or down.
Setup Choices That Change Your Cost Structure
Big cost swings usually come from the operating model, not just the hardware price tag.
| Setup Choice | Capital Cost | Training Burden | Latency Requirement | Throughput | Reset/Recovery Burden | Effect on Accepted-Demo Cost |
|---|---|---|---|---|---|---|
| Local operation | Higher on-site infrastructure, less network dependence | Usually simpler onboarding | Low to moderate | High when the station is well utilized | Faster physical intervention | Often lower for contact-rich or failure-prone tasks |
| Remote operation | Lower geographic staffing constraints, requires reliable connectivity and monitoring | Requires remote-workflow training | High, especially for bimanual tasks | High for repeatable tasks when connectivity is stable | Higher if physical resets require on-site staff | Favorable only when connectivity and recovery are reliable |
| Leader-follower control | Higher rig cost | Higher initial training, better long-term consistency | Low latency is important | Often highest for dexterous manipulation | Corrections are usually intuitive | Can reduce cost per accepted demo through higher throughput |
| VR or handheld control | Lower startup cost | Requires more operator adaptation | Moderate to high | Lower for contact-rich or bimanual tasks | Moderate | Competitive only when task complexity is low |
| Dedicated workcell | Higher capital cost | Easier standardization | Controlled environment | High after setup | Low - tools and fixtures are fixed | Usually lower at sustained utilization |
| Unstructured environment | Lower initial capital | Operators learn variable layouts | More environmental variability | Less predictable | Higher reset and troubleshooting burden | Attractive for pilots; often more expensive at scale |
Leader-follower stations are often quoted at $5,000–$20,000, while exoskeleton-based programs can reach $50,000–$150,000 per station. The main thing to compare is the amortized station cost per accepted demo, not the sticker price per attempt.
Published throughput ranges also show a clear gap in many cases: experienced tabletop operators can reach roughly 20–40 successful demonstrations per hour with leader-follower systems, compared with about 10–20 using VR. Those numbers are useful for planning, but they aren't magic. Task complexity and reset time can easily outweigh them.
Once the station setup is locked in, process quality becomes the next big cost lever.
Actions That Lower Cost Without Cutting Data Quality
If you want lower costs without hurting the dataset, start with rejection rate and reset time before pushing operators to move faster. Speed sounds good on paper, but bad runs and long recoveries can eat the savings.
Track rejection reasons by category:
- operator error
- robot fault
- occlusion
- timing error
- bad reset
- labeling problem
Then fix the biggest bucket first. If half your losses come from one issue, that's the loose floorboard. Step on it enough times and it becomes the whole story.
Automated QA checks should run before any human reviewer touches the queue. That includes synchronization, missing frames, sensor dropout, workspace violations, and episode duration. This keeps QA labor focused on the cases that actually need judgment, instead of wasting time on failures software can spot in seconds.
Skill matching matters too. Simple, tightly standardized tasks don't need your best operators. Save experienced operators for dexterous, bimanual, or contact-rich work. That can lower rejection rates while also cutting supervision load.
Recovery planning is another place where teams often lose money without noticing it. Keeping calibrated spare cameras, grippers, and cables on hand - and using standard reset procedures - can shorten recovery time and trim downtime.
Human-in-the-loop autonomy can also help, but only when used in the right spots. Shared control works best when routine motion is handled by the system and the operator steps in for ambiguous or safety-critical parts. One reported study found collection speed rising from 121 to 151 samples per hour and real-world success improving from 70% to 79% when shared control was used, while keeping downstream data quality comparable.
And one rule should stay fixed: count a demo only after it passes the prewritten task, sensor, safety, and labeling criteria.
A Simple Budget Worksheet and Key Takeaways
Every input should be translated into accepted demos, not just recorded attempts.
A practical monthly budget can start with one manipulation station scheduled for 160 hours per month. If you use a fully loaded operator rate of $40/hour, supervisor allocation of $8/hour, robot and station amortization of $12/hour, connectivity and software of $6/hour, storage and routine QA of $4/hour, and shared overhead and maintenance reserve of $10/hour, the total hourly operating cost comes to $80.
At 75% utilization, that station delivers 120 productive hours, produces 1,800 attempts at 15 per hour, and yields 1,440 accepted demonstrations at an 80% acceptance rate. Monthly cost: $9,600. Cost per attempt: about $5.33. Cost per accepted demo: about $6.67.
Here are the worksheet inputs and outputs that matter most:
| Category | Inputs | Outputs |
|---|---|---|
| Labor | Fully loaded operator rate, supervisor allocation | Cost per attempt |
| Throughput | Demo duration, reset time, attempts per hour | Cost per accepted demo |
| Quality | Acceptance rate, QA minutes per demo | Accepted demos per operator-hour |
| Robot | Amortized hardware cost, maintenance reserve | Monthly accepted-demo capacity |
| Infrastructure | Connectivity, software licensing, storage | Monthly budget total |
| Overhead | Facility, downtime, engineering allocation | Fully loaded cost per accepted demo |
One small spreadsheet change can make a big difference: include a separate failure-recovery line instead of hiding it inside average demo duration. That makes recurring hardware faults, recalibration events, and emergency interventions visible. Once you can see that cost clearly, you can go after it.
When moving from pilot to production, run sensitivity analysis on four variables in particular:
- acceptance rate
- attempts per hour
- utilization
- hourly infrastructure cost
Those four usually move cost per accepted demo far more than any single consumable line item.
FAQs
What counts as an accepted demo?
An accepted demonstration is a clean, repeatable record of the full task flow, including any needed recovery steps, with no major data defects.
For training, it needs to pass quality review and stay free of label noise, timing gaps, dropped frames, and camera sync issues. It also has to match the robot’s kinematics and contact constraints. The goal is simple: provide a complete state-action trace that clearly teaches both the intended task and the right recovery behavior.
Which costs are often missed?
Teams often overlook costs tied to data quality and infrastructure upkeep. Operator labor is easy to spot. But the work that happens around bad data? That’s where budgets quietly leak.
A common example is raw episode filtering. It’s not unusual to throw out 20% to 40% of collected episodes because of label noise, sync errors, or timing gaps. On paper, data collection may look efficient. In practice, a big chunk of that data may never make it into training.
Other costs get missed for the same reason: they sit in the background until they start slowing everything down. That includes:
- Hardware calibration, resets, and repairs
- Storage, alignment, and cleaning of multimodal sensor data
- Manual failure recovery
- Time lost rebuilding task state and history
None of this is glamorous, but it adds up fast. And if a team doesn’t plan for it early, the total cost of running the system can end up much higher than expected.
How can I lower cost without hurting quality?
Lower teleoperation costs by making the data pipeline work better, not just by collecting more. Well-picked, clean data beats a huge pile of raw footage every time.
A lot of teams fall into the same trap: they chase volume and hope more data will fix the problem. But if the dataset is messy, repetitive, or full of low-value episodes, you end up paying for storage, review, labeling, and operator time without getting much back.
A better approach is to tighten the process from the start:
- Set strict capture standards upfront
- Automate QC to catch low-value episodes early
- Keep operators efficient with structured sessions and low-friction interfaces
- Feed intervention logs back into training to reduce future manual work
This shifts the focus from more data to better data. And that usually means lower teleoperation spend, less wasted effort, and a training loop that gets sharper over time.