Managed Teleop Ops vs Hiring Your Own Operators: The Break-Even Math

Leela Yanamaddi
November 16, 2026

Managed teleoperation costs less in all three examples below - but the break-even point depends on matching coverage, not hourly rates. In the hypothetical 24/7 case, managed service costs $5,000 per month, compared with $49,936 for six internal employees covering one response seat.
The calculation comes down to three checks:
- Match the service: Coverage hours, response times, simultaneous requests, safety rules, and backup staffing must align.
- Count the full cost: Compare managed fees, minimums, usage, and extras with internal payroll, relief staffing, training, supervision, tools, and startup costs.
- Test actual demand: Use 60–90 days of fleet data to check intervention hours, peaks, monitoring needs, and staffing steps.
Quick Comparison
| Comparison | Managed teleoperation | Internal team |
|---|---|---|
| Main cost drivers | Fixed fees, usage, standby, and minimums | Payroll, shift coverage, supervision, and tools |
| Low demand | Minimum charges may apply | Staff must still cover scheduled hours |
| Higher demand | Usage charges grow | More seats or employees may be needed |
| Best cost fit | Uncertain or intermittent demand | Predictable demand where total internal costs are lower |
| Terms to check | Response guarantees, extra charges, and data rights | Relief coverage, peak capacity, and data tools |
More work does not automatically make hiring cheaper. In these examples, internal labor alone costs $41.60 per paid hour, versus $35 per managed intervention hour. Recalculate monthly - and separate recurring costs from first-year setup spending.
Managed vs. In-House Teleoperation Costs
Use this checklist to separate bundled services, extra charges, and tasks your team still handles. Each row feeds into the monthly cost comparison.
| Cost category | Managed: included or separately charged? | Customer tasks under managed service | In-house treatment |
|---|---|---|---|
| Software | Platform fee; may include usage allowances or teleoperation hours | Provide compatible robot interfaces and approve integration, security, and privacy requirements | Licenses or development, hosting, maintenance, cybersecurity, and support |
| Labor | Operator time billed through service fees | Define permitted tasks and escalation rules | Wages, payroll taxes, benefits, and overtime |
| Recruiting | Provider recruits operators; confirm how fees apply | Approve required qualifications | Recruiting, screening, and replacement hiring |
| Onboarding | Deployment and robot onboarding may cost extra | Supply workflows and site information | Pay for workflow design and onboarding |
| Training | General training may be bundled; site-specific training may cost extra | Supply procedures and safety requirements | Paid training time and qualification costs |
| Supervision | Confirm supervisor and quality-review coverage | Keep customer-side oversight | Allocate supervisor time |
| Scheduling | Confirm handoffs, relief, and after-hours coverage | Define operating windows | Staff shifts, absences, and relief |
| Equipment | Confirm whether provider-side consoles are included | Handle robot-side hardware, maintenance, and repairs | Consoles, peripherals, and replacement equipment |
| Connectivity | Confirm provider-side redundancy | Provide reliable site network access | Operator and site network access |
| Safety monitoring | Confirm monitoring and incident-response scope | Handle site controls, incident decisions, and compliance | Staff monitoring and compliance reviews |
| Intervention reporting | Confirm logs, storage, exports, and retention charges | Review incidents and manage access | Pay for reporting tools, storage, and review time |
With responsibilities clear, split the managed quote into usage, standby, and minimum charges.
Managed Pricing: Usage, Standby, and Minimums
Usage pays for active handling. Standby pays for availability. How the provider bills each one determines the fixed and variable costs in your break-even calculation.
Reserved capacity can guarantee headcount, response time, or a coverage window - but not unlimited interventions. Ask whether pricing is per robot, per fleet, per operator-hour, per intervention, or per coverage seat. Also check whether unused minimums expire.
Request separate amounts for setup, integration, monthly minimums, overages, after-hours support, and emergency coverage. Confirm whether the provider supplies operators, supervisors, safety monitoring, shift handoffs, incident response, and intervention logs.
In-House Costs: Pay, Training, and Shift Coverage
Separate launch costs from recurring expenses. Launch costs include recruiting, background checks, onboarding, workflow design, safety qualification, and first-time equipment.
Recurring expenses include wages, payroll taxes, benefits, paid time off, recurring training, supervision, software subscriptions, connectivity, workstations, equipment replacement, compliance reviews, and turnover. Spell out shift premiums, too.
List launch costs separately or amortize them over 12 or 24 months - not both. These inputs determine the staffing levels used in the break-even formula.
Cost per productive hour = allocated annual operating cost ÷ productive operator hours.
Use this rate with the staffing calculation to estimate monthly labor costs. Document base pay, benefits percentage, premiums, and annual paid hours.
If 2,080 paid hours leave 1,560 productive hours after leave, breaks, training, meetings, and downtime, use 1,560 as the denominator.
If you price only active intervention time, add standby hours separately. Count supervision and equipment once, and do not discount those hours again.
Match Service Requirements Before Comparing Costs
Compare the same service on both sides. Match operating hours, coverage area, response targets, escalation rules, backup staffing, and safety standards. State whether coverage means monitoring, active control, or guaranteed response within a set number of seconds. Also specify how robots must behave safely if the connection drops. Once the scope is set, turn demand into seats and monthly hours.
Low monthly utilization can mask overlapping demand and missed response targets. Check 30–90 days of timestamped demand for peak arrivals, simultaneous interventions, and 95th-percentile response time. Reject staffing plans that handle average demand but miss the response target.
Calculate Operator Demand From Fleet Activity
Define R as the number of robots, I as interventions per robot operating hour, D as operator-hours per intervention, and H as monthly operating hours per robot. Calculate active demand as:
[ Q = R \times I \times D \times H ]
Separately, define S as the tested number of robots one operator can monitor. Use S ONLY for passive monitoring. Active control needs its own seat capacity. If active control interrupts monitoring, check that another operator can cover the remaining robots. Don’t count the same capacity twice.
[ \text{Monitoring seats} = \left\lceil \frac{\text{robots operating at the same time}}{S} \right\rceil ]
This seat demand sets the lower bound for shift coverage.
Size Teams for 1 Shift, 2 Shifts, and 24/7
Let K be usable monthly coverage hours per employee after a single allowance for leave, breaks, training, and absence. Let N be the concurrent seats needed to meet monitoring limits and handle simultaneous interventions.
The table gives the cost model a coverage floor - not a final roster. Check shift assignments, handoffs, and relief coverage before calculating team costs.
| Schedule | Operating hours/month | Concurrent seats | Coverage hours before allowances | Active capacity at utilization (U) | Minimum rounded headcount | Response-time limit |
|---|---|---|---|---|---|---|
| 1 shift: 8 hours/day, 26 days | 208 | N | 208N | 208NU | (\lceil 208N/K \rceil) | Must hold during breaks and peaks |
| 2 shifts: 16 hours/day, 26 days | 416 | N | 416N | 416NU | (\lceil 416N/K \rceil) | Must hold through handoffs and peaks |
| 24/7: 30-day month | 720 | N | 720N | 720NU | (\lceil 720N/K \rceil) | Must hold overnight, weekends, and holidays |
For multiple concurrent seats, multiply operating hours by seat count before dividing by K.
Build the Monthly Break-Even Formula
Once demand is expressed in hours and seats, convert it into monthly cost.
Define P as the managed price per billable operator-hour, W as internal labor cost per paid hour, and U as productive utilization. F_internal represents fixed monthly internal costs excluding labor; F_managed represents managed monthly fixed fees. Let C_coverage be the paid hours needed to meet the coverage schedule, including relief allowances.
Start with paid workload hours of Q/U. Then account for coverage, peak-response requirements, and whole-person staffing limits. Don’t apply the same allowance twice, and follow the contract’s billing rules.
[ \text{Paid workload hours} = \frac{Q}{U} ]
[ C_{\text{staffed}} = \max\left(\frac{Q}{U}, C_{\text{coverage}}\right) ]
[ C_{\text{internal}} = F_{\text{internal}} + W \times C_{\text{staffed}} ]
For an hour-based managed minimum, Q_min:
[ C_{\text{managed}} = F_{\text{managed}} + P \times \max(Q, Q_{\min}) ]
Add separately billed standby or escalation charges only if they aren’t already included.
Monthly break-even occurs where these totals match. Minimum charges, staffing steps, added shifts, and monitoring limits call for a piecewise spreadsheet rather than a single break-even number.
Worked Examples: When Each Option Costs Less
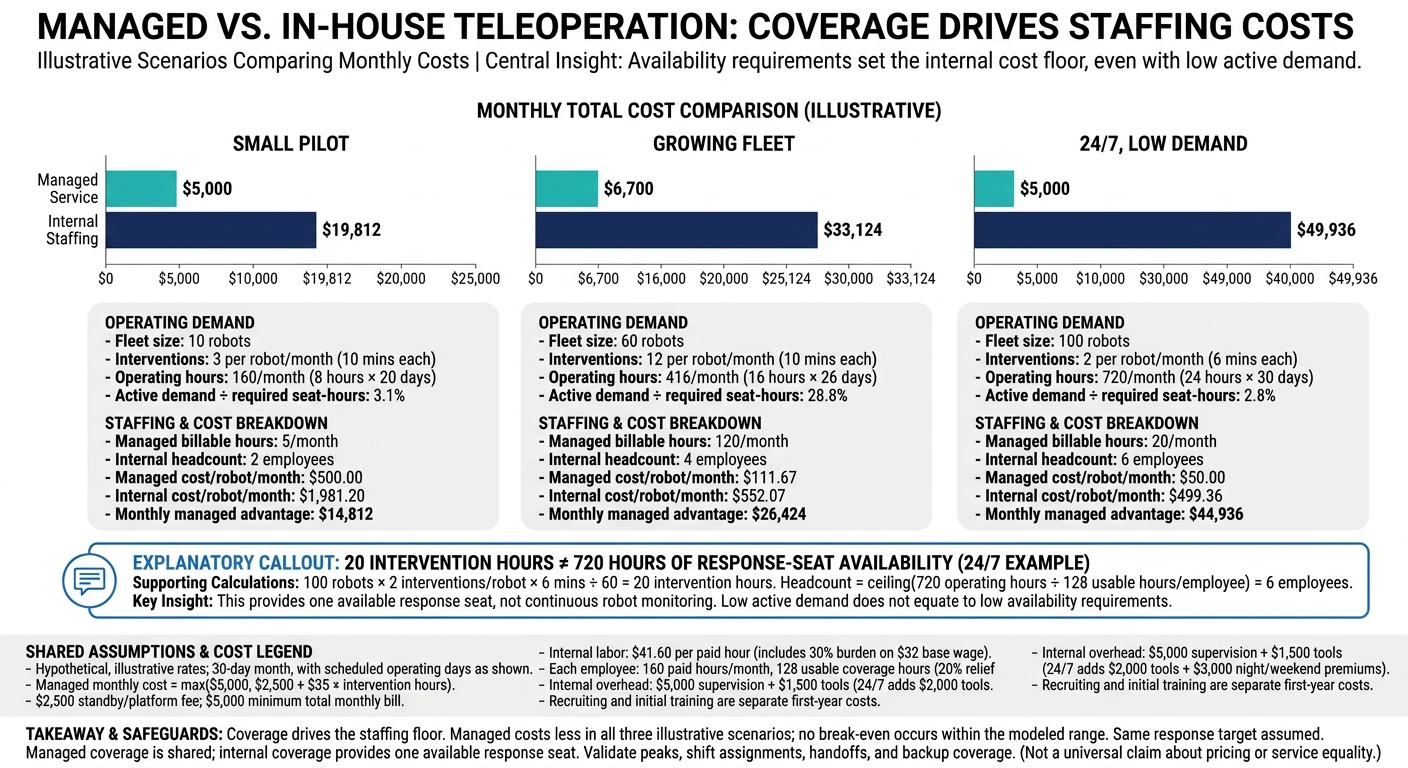
Managed vs. In-House Teleoperation: Monthly Cost Comparison
These hypothetical calculations use illustrative rates. Assume a 30-day month, a $35 managed intervention-hour rate, a $2,500 standby/platform fee, and a $5,000 minimum total monthly bill:
[ C_{\text{managed}}=\max($5{,}000,\ $2{,}500+$35Q) ]
Escalation costs an additional $150 per hour; these examples assume none. Internal labor costs $41.60 per paid hour, including a 30% burden on a $32 base wage. Each employee provides 160 paid hours and 128 usable coverage hours after one 20% relief allowance. Round headcount up to whole employees.
Monthly internal overhead includes $5,000 for supervision and $1,500 for tools. For 24/7 coverage, tools cost $2,000, and night/weekend premiums add $3,000.
All three cases use intervention-only coverage and the same response target. Managed coverage is shared; internal coverage provides one available response seat. Pricing stays constant - only workload and coverage change.
Small Pilot, Then Scaling Up
The managed minimum wins for the pilot because internal coverage still requires a staffed seat. Scaling to two shifts raises the internal staffing floor to four employees.
Recurring internal totals include labor, supervision, and tools, plus night/weekend premiums in the 24/7 case. Recruiting and initial training are separate first-year costs.
Monthly measure Small pilot Growing fleet 24/7, low demand Fleet size 10 60 100 Interventions per robot/month 3 12 2 Minutes per intervention 10 10 6 Continuous monitoring No No No Operating hours within a 30-day month 160: 8 hr × 20 scheduled days 416: 16 hr × 26 scheduled days 720: 24 hr × 30 days Active demand ÷ required seat-hours 3.1% 28.8% 2.8% Managed billable intervention hours 5 120 20 Internal headcount: ceiling of operating hours ÷ 128 2 4 6 Internal paid hours: headcount × 160 320 640 960 Managed monthly total $5,000 $6,700 $5,000 Internal monthly total $19,812 $33,124 $49,936 Managed cost per robot/month $500.00 $111.67 $50.00 Internal cost per robot/month $1,981.20 $552.07 $499.36 Monthly managed advantage $14,812 $26,424 $44,936 Annual managed advantage: 12 identical months $177,744 $317,088 $539,232 Break-even within modeled range? No No No
Internal staffing costs increase in steps as coverage needs grow. Managed costs follow the contract’s minimum bill and hourly rate.
24/7 Coverage With Low Intervention Demand
One hundred robots generate 20 intervention hours: 100 × two interventions × six minutes ÷ 60. Maintaining one available response seat - not continuous robot monitoring - requires six employees: ceiling of 720 ÷ 128. Internal monthly cost is $49,936, versus the $5,000 managed minimum. These are staffing floors; validate shift assignments and backup coverage against the response target.
Budget overnight escalation support separately if the supervisor allocation cannot cover it.
The next tests change one input at a time to show how each assumption affects break-even.
Test How Demand and Service Targets Change Costs
More demand does not guarantee an internal win. Internal labor costs $41.60 per paid hour, compared with $35 per managed intervention hour - and that’s before internal idle time or overhead. Each test changes one variable in the cost comparison above.
Change tested Managed effect Internal effect and break-even impact 24/7 frequency: 2 → 10 interventions per robot/month Billable intervention hours increase from 20 to 100; total becomes $6,000 Six-person coverage floor remains; managed advantage narrows to $43,936 Duration: 6 → 15 minutes, at two interventions/month Billable intervention hours increase from 20 to 50; $5,000 minimum still applies Staffing floor remains if peaks fit Continuous monitoring: no → yes Obtain a separate monitoring quote Recalculate seats using the tested monitoring limit; do not double-count intervention capacity Workload utilization ceiling: 70% → 30% Confirm whether pricing or reserved capacity changes Required workload hours, Q/U, increase; costs increase if they exceed the coverage floor Simultaneous requests: 1 → 3 Higher concurrency or priority fees may apply Recalculate peak seats and relief staffing Response target: 15 → 2 minutes Premium or dedicated capacity may be required Check whether additional ready staff or overlapping coverage is needed
Add startup costs separately, then report the recurring break-even point and first-year net difference.
[ \text{First-year internal cost} =12\times\text{monthly recurring cost}+\text{startup costs} ]
Conclusion: Choose by Workload and Coverage
Use the break-even model above to choose the lower-cost option at the same service level. Compare response times, availability, escalation duties, and peak capacity on equal terms.
Use the Cost Model and Review Your Decision
Favor managed coverage when demand is uncertain or intermittent. Choose internal staffing when predictable utilization puts it above the fully loaded break-even threshold. That threshold depends on utilization, coverage, and fully loaded cost.
Recalculate monthly, accounting for changes in fleet size, operating hours, response targets, pricing, or autonomy. Use intervention logs, coverage targets, an itemized managed quote, and a full staffing budget. Better autonomy can lower usage charges without lowering the minimum staffing needed for internal coverage.
Before signing, confirm data ownership, retention, export formats, analytics access, and training rights. Check Evlo.ai’s current scope and commercial terms directly. Don’t assume roadmap features, response guarantees, or 24/7 coverage are available.
| Factor | Managed teleoperation | Internal team |
|---|---|---|
| Cost control | Check minimums, usage rates, and overages | Control staffing spend while carrying fixed payroll and coverage costs |
| Coverage flexibility | Changes depend on contracted capacity and hours | Changes may require hiring, overtime, or new shifts |
| Data and analytics control | Depends on contract terms, export rights, retention, and provider integrations | More direct control, with tooling and governance costs |
| Likely cost fit | Uncertain or intermittent demand | Predictable workload above the break-even threshold |
FAQs
Could a hybrid staffing model lower my teleoperation costs?
Yes. Keep oversight and high-value escalations in-house, and use managed operators to handle demand spikes and coverage windows. This can cut idle in-house capacity while keeping sensitive workflows and incident decisions under your control.
The break-even math still applies. Compare total monthly costs at the same service level, including managed minimums and fees, internal fixed costs, and relief staffing needs. Hybrid staffing usually helps when demand is uneven or coverage hours are extended.
How should I budget for rare intervention spikes?
Budget for spikes, not average demand. Calculate staffing needs as exception rate × average handling time. Then add buffers for simultaneous incidents, response delays, and staff breaks or leave.
Test whether staffing can handle 2× or 3× bursts, operator absences, and intervention-rate increases of 300% to 400% during peaks or layout changes. Until autonomy matures, treat backup capacity as a core operating expense.
What transition costs should I expect when bringing operators in-house?
Include one-time costs for recruiting, initial training, protocol design, facility setup, and hardware calibration. Depending on the instrumentation required, setup can cost $5,000 to $200,000 per station, pushing your break-even point higher.
Spread these startup costs over 12, 24, or 36 months in your model. Your in-house team needs enough intervention volume over that period to cover those costs before its cost per intervention drops below what a managed service charges.