Disconnected Dashboards Are Quietly Killing Factory Productivity

Leela Yanamaddi
August 17, 2026
If your factory runs on five dashboards, your team is probably losing time on every shift.
I see the main problem like this: the data exists, but it sits in separate systems that do not line up. That leads to slower response, lower throughput, and hidden downtime. Even small delays - like checking three tools before making one call - can add up to hours per week across supervisors, maintenance, quality, and warehouse teams.
Here’s the short version:
- Teams work from split views of robots, lines, quality, maintenance, warehouse flow, and labor
- Alerts show up without shared context, so people must piece events together by hand
- KPIs can conflict, which slows decisions and handoffs
- Labor time gets wasted on status checks instead of fixing issues
- The fix is not another dashboard
- The fix is a shared data layer, one incident timeline, and role-based views
In plain English: when systems do not connect, people spend more time figuring out what happened than fixing what happened.
A simple side-by-side view makes the issue clear:
| Area | Split Dashboard Setup | Unified Setup |
|---|---|---|
| Data view | Info stays in separate tools | One shared view across factory systems |
| Alerts | Signals arrive in different places | Alerts connect to one timeline |
| Decisions | Teams reconcile numbers by hand | Teams act from the same picture |
| Labor time | More checking, more calls, more handoffs | More time spent on the actual issue |
Bottom line: if you want better uptime and more output, start below the screen level. Connect the data first, then build the views people need.
Smart Manufacturing Command Center: Boost Productivity with the Manufacturing Control Tower
How Disconnected Dashboards Break Daily Factory Operations
Fragmented dashboards get in the way of day-to-day factory work across production, robotics, inventory flow, maintenance, and incident response.
Separate Views for Robot Health, Line Performance, and Warehouse Flow
Picture a robotic arm on an assembly line starting to slow down because of a worn joint. The robot health dashboard still says the unit is operational. At the same time, the production line dashboard logs growing idle time farther down the line. The problem? Those two signals never meet.
Now add one more issue. A slowdown in warehouse flow is delaying part deliveries to that same line. That shows up only in a third system, with no tie to the line slowdown building in real time. By the time a supervisor pieces it together, the line has already lost time. Small delays turn into missed chances to act.
Quality, Maintenance, and Incident Tracking That Do Not Share Context
When a defect spike hits a production run, the quality team logs it in its own system. If the root cause traces back to a repeat machine fault, maintenance has that record in a separate work order platform. And if an operator reported a near-miss during that same period, that note sits in yet another incident tracking tool.
On paper, each team has part of the story. In practice, the story is split up. These systems often don't share timestamps, machine IDs, or incident context. The result is a black box: teams can see the failure, but not the full chain behind it.
Conflicting KPIs That Slow Down Decisions
Disconnected dashboards don't just split visibility. They also create conflicting KPIs. One system might show a line running normally, while another shows reduced output for the same shift, simply because each one defines uptime in a different way.
Before a supervisor or engineer can decide what to do - pull in a technician, change the schedule, or escalate the issue to plant management - they first have to reconcile the numbers by hand. That's extra friction on every call. And as more tools pile up, that reconciliation step takes longer.
Those delays show up fast: slower response, lower throughput, and downtime that stays hidden for longer than it should.
The Real Cost: Slower Response, Lower Throughput, and Hidden Downtime
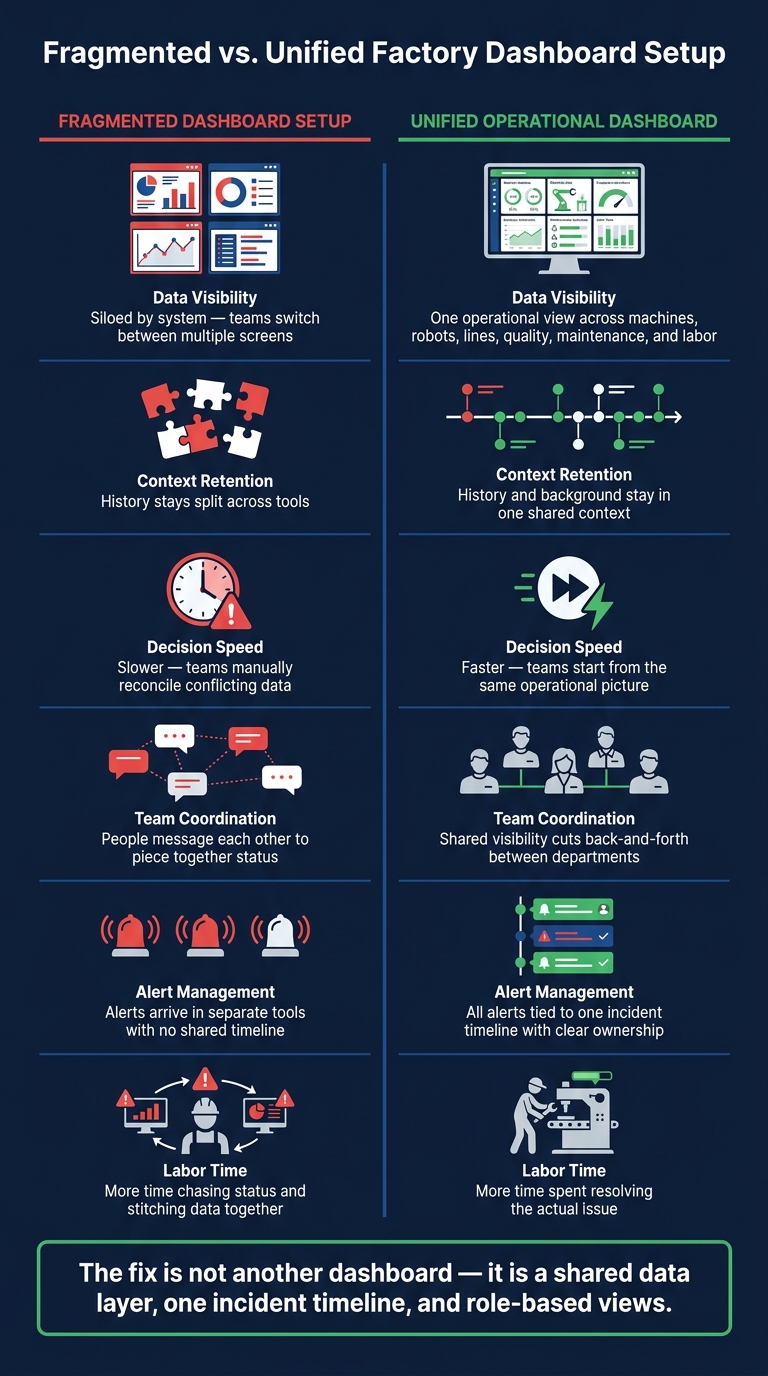
Fragmented vs. Unified Factory Dashboards: Operational Impact
The cost shows up all across the shift: slower response, lower throughput, and downtime that quietly eats away at output.
Longer Time to Detect and Respond to Problems
When a machine drifts out of tolerance or a robot stalls mid-cycle, the first clue might appear in one dashboard while the hit to production shows up somewhere else. A robot alert, a line slowdown, and a parts delay can land in separate tools with no shared timestamp. In a fragmented setup, teams may notice the alert but miss the production impact or the incident context. That slows detection, delays escalation, and makes root-cause analysis harder because the full story is split across tools.
The result is simple: recovery takes longer, teams spend more time cross-checking data, and more of the shift gets burned on troubleshooting instead of production. Then it happens again when the next signal lives in yet another system.
More Labor Spent Chasing Status Instead of Fixing Problems
Fragmentation also drains labor time. Maintenance leads, supervisors, and engineers often have to bounce between systems and re-check what happened before they can do anything useful. That repeated handoff work comes from lost context. Every new tool makes people restate what they already know.
You can see it on the factory floor. Teams jump between dashboards just to build a basic incident timeline. The data is there, but people still have to stitch it together by hand. Every minute spent reconciling systems is a minute not spent fixing the problem.
Fragmented Dashboards vs. Unified Operations: A Direct Comparison
Here’s what that looks like in practice.
| Operational Area | Fragmented Dashboard Setup | Unified Operational Dashboard |
|---|---|---|
| Data Visibility | Siloed by system; teams switch between multiple screens | One operational view across machines, robots, lines, quality, maintenance, and labor |
| Context Retention | History stays split across tools | History and background stay in one context |
| Decision Speed | Slower because teams must manually reconcile data | Faster because teams start with the same operational picture |
| Team Coordination | People have to message each other to piece together status | Shared visibility cuts back-and-forth between departments |
That’s why the next step is a shared data layer, not just another dashboard.
What a Unified Factory Dashboard Stack Needs
Fixing dashboard fragmentation takes infrastructure, not just another screen. The fix starts below the dashboard level, in the data layer and alert logic that connect every system.
A Shared Data Layer Across Machines, Robots, and Business Systems
At the center of it is a single, consistent data layer that pulls from every part of the operation: machine telemetry, robot fleet status, production line output, quality records, maintenance events, warehouse flow, and labor activity.
When every system works from the same data model, teams stop arguing over different versions of the truth. They can move faster because they spend less time chasing status, checking numbers, and stitching together updates from separate tools. That also cuts hidden downtime that slips in while people are still trying to figure out what’s happening.
Cross-System Alerts Tied to One Incident Timeline
Alerts only matter if people can act on them. A machine alarm on its own - without any link to the quality deviation that came before it or the maintenance work that should follow - doesn’t give clarity. It just adds noise.
Cross-system alerting ties every signal to one shared incident timeline. A machine alarm connects to the quality deviation and the maintenance action it should trigger, so the whole incident stays in one record with one owner and one path to resolution. Nothing gets stranded in a separate system, and no team has to rebuild the timeline by hand. Escalation paths are set ahead of time, so people aren’t stuck figuring out ownership in the middle of a shift.
Role-Based Dashboards and Factory Intelligence Tools
Once the shared data layer and incident timeline are in place, dashboards can match each role without splitting the truth.
Operators need real-time station status: what’s running, what’s faulted, and what needs attention right now. Supervisors need a cross-line view so they can shift resources and catch bottlenecks before they spread. Plant leaders need trend data and cost impact, including how much unplanned downtime cost this week, whether throughput is on pace for the monthly target, and what a change in uptime is worth in dollars and output.
evlo.ai's Manufacturing Brain sits on top of the shared data layer, monitors operations continuously, and turns operator and engineer knowledge into faster decisions across machines, robots, and production workflows. From there, factory intelligence tools turn the same operational data into actions for operators, supervisors, and plant leaders.
Conclusion: Fix the Data Disconnect to Improve Uptime and Coordination
Disconnected dashboards don’t just slow people down for a moment. They create small delays that stack up and turn into lost output and slower response times. Teams end up spending entire shifts chasing status updates and piecing timelines back together when that context should already be shared across machines, robots, production lines, quality systems, maintenance, and labor.
The answer isn’t more dashboards. It’s shared infrastructure.
A unified stack gives teams:
- One shared data layer
- Cross-system alerts tied to a single incident timeline
- Role-based factory intelligence
That setup turns fragmented visibility into faster, real-time action. Instead of managing disconnected data all day, teams can focus on improving uptime, coordination, and throughput.
FAQs
How can I tell if dashboard fragmentation is hurting my factory?
The provided sources don't include information on dashboard fragmentation, factory productivity, or how to spot it.
So, based on those sources alone, you can't answer the question yet.
You'd need extra sources that cover practical signs such as:
- delayed alerts
- conflicting views across lines or robots
- missed quality issues
- missed maintenance events
What should a shared data layer connect first?
Start by connecting the separate systems for robot health, production line performance, warehouse flow, and incident tracking.
That gives you one shared view across the factory floor. It helps teams spot delays that usually stay hidden, see how issues in one area affect another, and make faster decisions based on data instead of guesswork.
How long does it take to unify factory dashboards?
The available information does not say how long it takes to unify factory dashboards.
Based on the results provided, there’s no stated timeline for these infrastructure changes.