How AI Turns Raw Factory Data Into Real-Time Decisions

Leela Yanamaddi
August 4, 2026
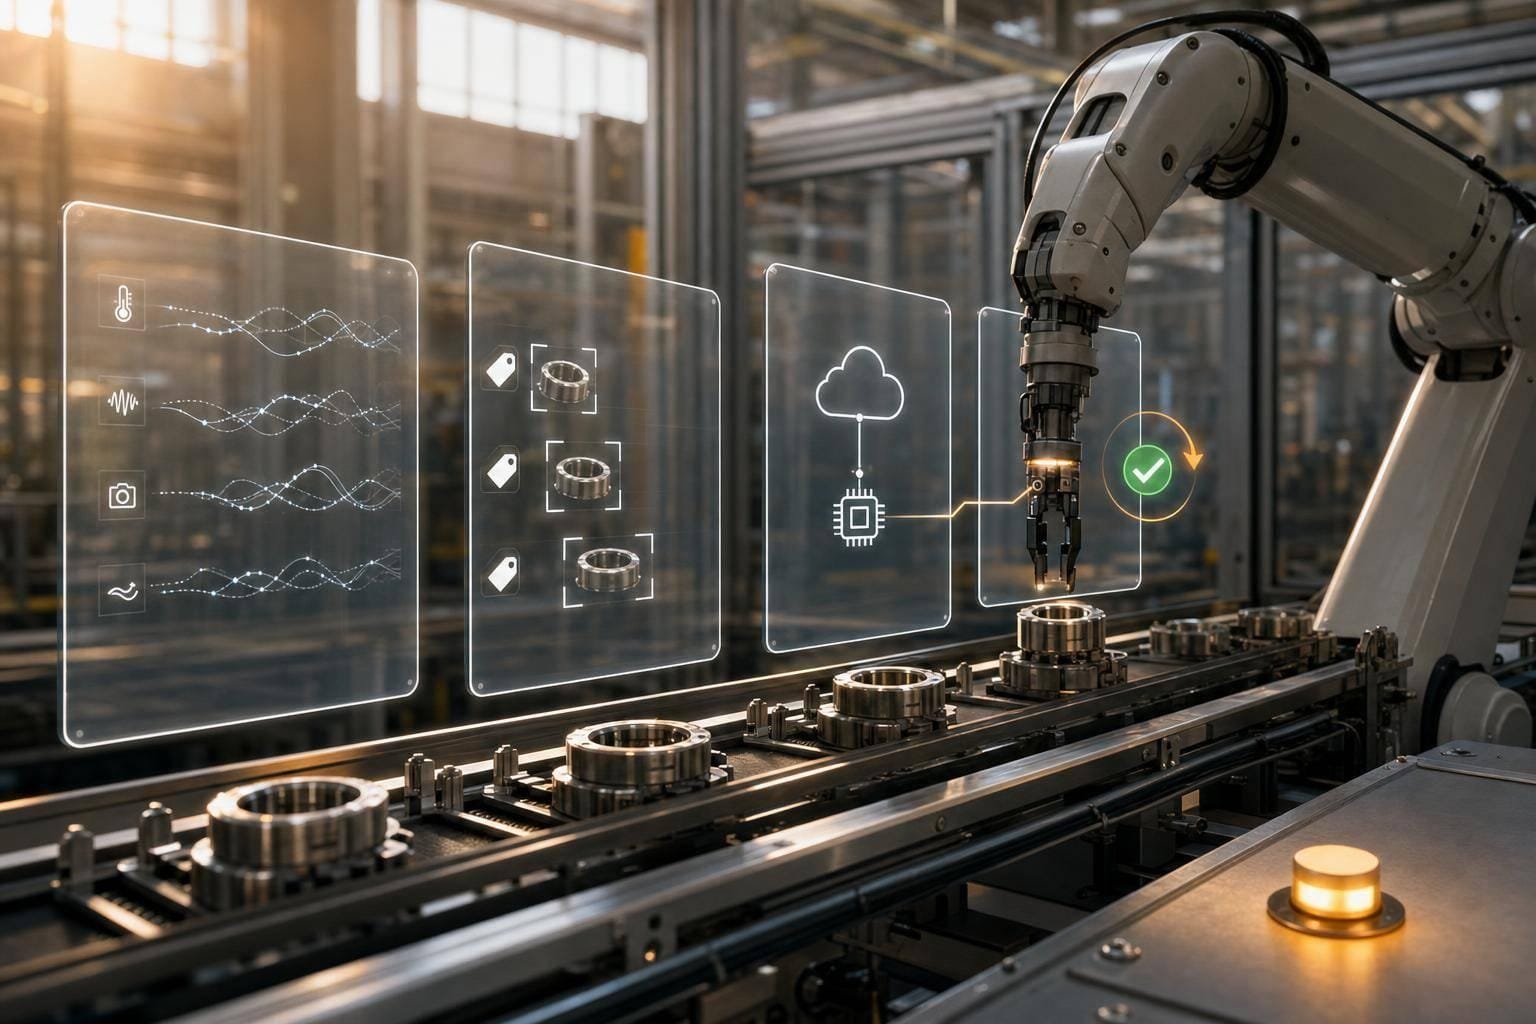
AI helps factories act on data in seconds to minutes, not after the shift ends. I’d sum it up like this: start with one use case, clean and connect your data, turn signals into alerts or next steps, send those actions into the tools people already use, and learn from every human override.
Here’s the article in plain English:
- Pick one problem first like downtime, scrap, or robot interventions
- Set a clear target such as OEE, downtime hours, or unit cost
- Connect factory and business data from PLCs, sensors, cameras, MES, ERP, LIMS, and CMMS
- Clean the data with synced timestamps, shared tags, and labeled events
- Run AI where timing fits
- Edge for sub-100 ms decisions like vision checks
- Cloud for model training and site-to-site analysis
- Start with advisory mode so people approve actions before AI acts on its own
- Push decisions into work tools like HMIs, MES, CMMS, QMS, and mobile apps
- Keep safety logic fixed for stops, interlocks, and hard limits
- Use overrides as training data so the system improves over time
- Scale with one shared data layer across lines and sites
A few numbers stand out:
- Predictive maintenance can cut unplanned downtime by up to 47%
- Vision models can spot defects in under 75 ms
- One OEE point on a packaging line can be worth about $300,000 per year
- One factory example showed 297% ROI and a 50%+ drop in downtime
The main idea is simple: AI is not about collecting more data. It’s about getting the right signal to the right person - or system - fast enough to change what happens on the floor.
If I were putting this into one sentence, I’d say: clean data + clear decision timing + workflow integration = AI that people can use.
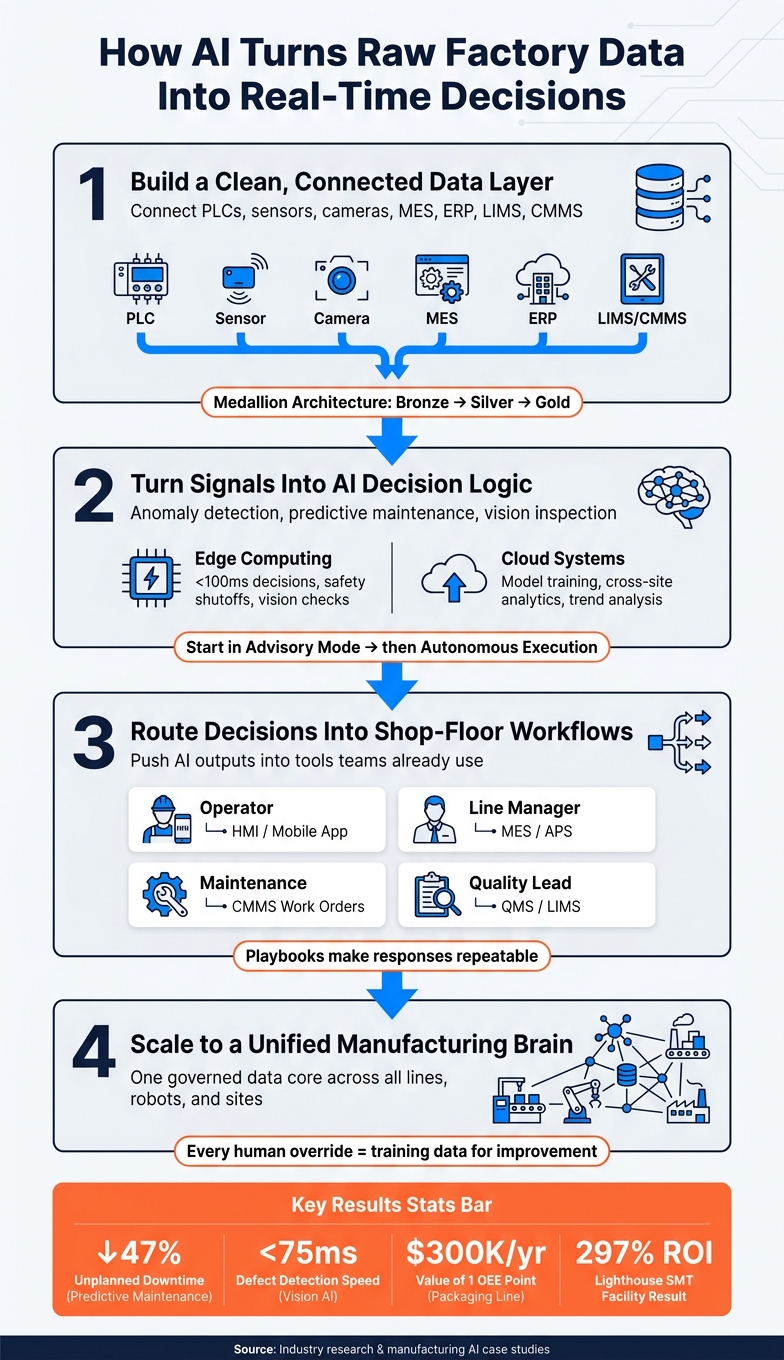
How AI Turns Factory Data Into Real-Time Decisions: 4-Step Framework
How to Scale Industrial AI in Real Factory Operations
Step 1: Build a Clean, Connected Factory Data Layer
AI needs a clean, unified data layer before it can make dependable shop-floor decisions. If data isn’t synchronized and tied to the right context, AI can’t respond in time. This is the layer that makes slowdown detection, failure prediction, and quality flags work in real time.
Connect machine, robot, vision, and production data
Bring shop-floor data and business-system data into one layer. On the shop floor, that includes PLC and SCADA telemetry, robot logs, industrial camera feeds, and sensor streams for temperature, pressure, and vibration. On the business side, you need MES data for downtime codes and quality holds, ERP data for inventory and schedules, LIMS data for quality results, and CMMS data for maintenance history.
Use OPC UA or MQTT to stream equipment and system data into one pipeline. If you’re dealing with older equipment, protocol converters can translate Modbus or proprietary SCADA APIs into formats your AI layer can ingest.
| Data Source | Examples | What It Adds |
|---|---|---|
| Machine / OT | PLCs, CNCs, robots, sensors | Provides sub-second telemetry on state, speed, and health |
| Vision systems | Industrial cameras | Enables real-time defect detection and quality inspection |
| Execution (MES) | Production orders, quality holds | Provides context on what is being built and its quality status |
| Enterprise (ERP) | Inventory, customer demand | Helps prioritize AI recommendations based on business impact |
| Maintenance (CMMS) | Repair logs, history | Informs predictive maintenance and root cause analysis |
Once these sources are connected, standardized, and time-aligned, AI can compare events across machines, shifts, and orders. That’s when patterns start to show up instead of getting buried in disconnected logs.
Standardize tags, timestamps, and labels
If two CNCs label the same event in different ways, or if their clocks drift apart, AI will struggle to connect what happened across the line.
Synchronized clocks, consistent tag names, and standardized downtime reason codes are must-haves. You also need labeled failure and defect events, not just raw sensor readings, so the model can learn what “bad” looks like in your plant. On top of that, run automated checks as data enters the pipeline for missing values, out-of-range readings, and drifting sensor values. It’s a lot easier to stop bad data at the door than to clean up the mess later.
A practical way to organize this is the medallion layout:
- Bronze for raw ingested data
- Silver for cleaned and enriched data
- Gold for aggregated, AI-ready outputs
This setup keeps data provenance intact and makes it easier to trace any decision back to its source.
Add human and task context with evlo.ai data infrastructure

Machine signals alone don’t tell the whole story. A cycle time deviation on a press line can mean one thing if an operator just used a manual override, and something else entirely if the machine has been running the same way for six hours. That gap between sensor data and what’s actually happening on the floor is where AI often loses the plot.
This is where evlo.ai's Physical AI Data Infrastructure comes in. Beyond standard telemetry, evlo.ai extends the data layer with multimodal human data: egocentric video, wearable-device recordings, human task demonstrations, and sensor streams that show how work is actually done around machines and robots. Those inputs help AI tell the difference between manual overrides, task changes, and actual equipment issues - so it can react to what’s happening on the floor, not just what the sensors happen to report.
Once the data layer is clean and tied to the right context, AI can score live signals and trigger the right response. With that layer in place, the next step is turning raw signals into alerts, recommendations, and controlled actions.
Step 2: Turn Raw Data Into AI Signals and Decision Logic
Once you have a clean, unified data layer, the next job is pretty simple to describe and much harder to get right: turn raw signals into decisions people can use. That’s what the decision layer does. It spots drift, adds context, suggests the next move, and checks what happened after the action.
Detect slowdowns, failures, and quality risks
Cycle-time drift and bottleneck detection depend on anomaly detection models. These models flag departures from normal performance before a slowdown spreads to the next step in production. Predictive maintenance handles a different kind of problem. Models trained on machine telemetry and sensor patterns can spot early signs of failure before a machine breaks down. AI-powered predictive maintenance can cut unplanned downtime by as much as 47%, and advanced analytics methods have been shown to reduce machine downtime by 30% to 50% overall.
Vision-based quality inspection adds another decision path. High-speed industrial cameras using tuned object detection models, such as YOLOv11, can detect defects in under 75 milliseconds at the edge. That makes it possible to trigger pass/fail decisions or send parts to reinspection without slowing the line. In practice, it’s smarter to use separate models for downtime, quality, and maintenance. One model shouldn’t try to do everything.
Once a signal has been classified, the next step is deciding where that decision should run.
Choose edge or cloud based on latency and reliability
Where inference runs matters just as much as how it runs. The basic rule is clear: if a decision needs to happen in under 100 milliseconds, it belongs at the edge. Safety shutoffs, real-time anomaly detection, and vision inspection don’t have time to wait on a network round-trip. Edge devices help keep production lines responsive even when the network drops out, which is a normal headache on many shop floors.
Cloud systems are better suited for work that doesn’t need an instant response. That includes model retraining on past data, fleet benchmarking across sites, and long-range trend analysis.
| Factor | Edge Computing | Cloud Systems |
|---|---|---|
| Latency | Low, real-time response | Higher, analysis over time |
| Uptime | High - runs through connectivity failures | Dependent on network/WAN reliability |
| Maintenance | Distributed; requires local hardware management | Centralized; managed by provider |
| Primary Use | Machine monitoring, safety, vision inspection | Model training, fleet benchmarking, cross-site analytics |
| Cost | Higher upfront hardware investment | Higher bandwidth costs |
Start with advisory mode before autonomous execution
Start in advisory mode. Let the AI draft a work order, quality hold, or schedule change, then have a person approve it. Each time an operator accepts, edits, or rejects a recommendation, that response becomes feedback data. Thresholds get tighter, false positives fall, and the system gets better at learning what “actionable” means in your plant.
When the same type of decision keeps getting approved as written, it can move into limited autonomous execution. At that point, the AI can act within set limits, and each action stays logged with its inputs, assumptions, and the human approver who signed off.
Those approved decisions then move into the right shop-floor workflow. From there, the decision can flow into maintenance, quality, or scheduling systems.
Step 3: Put AI Decisions Into Shop-Floor Workflows
A dashboard alert isn't a decision. This step is where scored signals become assigned work. The goal is simple: push AI outputs into the tools your teams already use so a signal turns into action fast.
Route each decision to the right system and team
Route by role. Operators need station-level adjustment steps in their HMI or mobile app. Line managers need recovery cues - speed changes, overtime flags, and schedule shifts - sent through the MES or APS. Maintenance teams need ranked work orders in the CMMS, already filled in with the diagnosed fault, needed parts, and target completion time. Quality leads need deviation records in the QMS or LIMS with lot numbers, sample IDs, and severity scores attached from the start.
| Role | AI-Generated Output | System Integration |
|---|---|---|
| Line Manager | Recovery plan (speed, overtime, schedule) | MES / APS |
| Quality Lead | Deviation record (lot, sample ID, severity) | QMS / LIMS |
| Maintenance | Work order (fault, scope, parts, timing) | CMMS |
| Operator | Step-by-step station adjustment | HMI / Mobile App |
Don't send raw alerts if what people need is a work item. Pre-filled tasks are easier to act on. In practice, this often means showing them as decision cards in line dashboards.
Once each role receives the right work item, the next move is to make the response consistent.
Build response playbooks for common use cases
Routing gets the alert to the right person. Playbooks make the response repeatable. Here are three concrete examples:
- Predicted bearing failure: The AI spots abnormal vibration patterns and drafts a CMMS work order with the needed parts and a suggested maintenance window for the maintenance lead to approve. A food processing plant used this approach to detect bearing wear 72 to 96 hours before failure and schedule repairs during planned downtime.
- Line slowdown: Cycle-time drift triggers a recommendation for labor reallocation or a speed adjustment. The line manager reviews and approves it in a mobile dashboard, and the update flows into the MES.
- Quality hold: Vision AI flags a defect, calculates a risk score, creates a hold record in the QMS, and the quality lead reviews and dispositions the affected lot .
Each playbook should end with a verify step. Did the action fix the issue or not? That bit matters, because the answer closes the loop.
After the workflow is repeatable, the next limit is deciding what the AI can change on its own and what still needs a person in the loop.
Keep safety-critical actions deterministic and auditable
Keep optimization separate from safety. Emergency stops, interlocks, and hard limits must stay deterministic and auditable .
Use human approval for schedule recovery and quality holds. Use bounded autonomy only for tightly constrained actions that need milliseconds, such as high-speed rejects.
Log every action with its inputs, constraints, approver, and outcome. Those records become the input for the next layer: facility-wide learning.
Step 4: Scale From One Use Case to a Unified Manufacturing Brain
Once your first use case is live - alerts go to the right people, playbooks run the same way each time, and actions are logged and checked - the question changes from does this work? to how far can this spread?
Use teleoperation and interventions as learning data
Every time a person steps in to fix a robot, approve a work order, or overrule an AI recommendation, that moment matters. Treat each one as structured data.
Evlo.ai's teleoperation layer is built around that idea. When a remote operator helps a robot through an unfamiliar task or a failure case, the session creates interaction data tied directly to the approval, rejection, override, and correction actions described in Step 3. Those records help train the next recommendation.
The main thing to track is the why behind each override, not only that it happened. If someone rejects, approves, or corrects a recommendation, the reason gives the system something useful to learn from. That makes future recommendations sharper and helps robot actions improve over time.
That feedback loop is what turns one pilot that works into a system you can expand. After that, the same feedback needs a shared, facility-wide data model.
Create one intelligence layer across the facility
Scaling takes one unified data core - a governed layer where OT, MES, ERP, and LIMS data use shared tags, timestamps, and permissions. With one governed data core, each new line can reuse the same decision logic. Without it, every new line turns into another integration job.
That is the Manufacturing Brain architecture - a shared layer that connects robots, machines, teleoperators, and production workflows in one live decision loop across machines, robots, and people. Instead of using one generic model, the system uses separate agents for downtime, quality, and scheduling. Each one focuses on the data and limits that matter most.
The trigger for scaling is decision latency: the time from signal to action. Systems are ready for broader rollout when they keep cutting that window from hours to minutes.
A lighthouse SMT facility saw a 297% ROI and a 50%+ drop in downtime after standardizing data across global lines.
"The improvement does not come from the data itself. It comes from how fast the loop runs." - Arch Systems
Once that layer is in place, scaling becomes a speed issue, not a scope issue.
Conclusion: From Fragmented Data to Live Decisions
The path from raw factory data to real-time decisions follows a clear sequence. First, define a specific decision window and choose one measurable use case to prove the idea. Second, build a clean, connected data layer that standardizes machine signals, timestamps, and context. Third, turn those signals into AI decision logic - starting in advisory mode before moving toward autonomous execution. Fourth, route AI outputs into the workflows your teams already use, with playbooks that make responses repeatable and safety-critical actions that remain deterministic and auditable. Finally, use every human intervention and teleoperation session as structured learning data, then extend that intelligence layer across the facility.
For U.S. manufacturers, the results are concrete: faster response to line disruptions, lower unplanned downtime, fewer quality escapes, and better use of both labor and robots on every shift.
FAQs
How do you choose the best AI use case to start with?
Start with a use case where decisions need to happen fast and the business impact is easy to track. Good examples include line slowdowns, equipment failure risk, quality holds, or throughput recovery.
Keep the scope tight from day one. Define the requirements up front, including standard event formats, the operational context each event needs, and outputs that teams can trace back to the source.
Then build the full end-to-end loop and measure results over 30 to 90 days. Focus on KPIs such as:
- decision latency
- OEE
- defect reduction
- MTTD/MTTR
That way, you’re not judging the work on gut feel. You’re tying it to outcomes people on the floor can see.
What data problems usually block real-time AI decisions?
The biggest issue is data fragmentation.
In many plants, critical information gets trapped in separate systems like PLCs, SCADA, MES, ERP, and LIMS. The result is slow, manual reconciliation and conflicting versions of the truth. One team looks at one number, another team sees something else, and now everyone’s wasting time trying to figure out which view is right.
A lot of manufacturers also still rely on retrospective dashboards instead of real-time ingestion. That creates a lag between what’s happening on the floor and the decisions people make. On top of that, raw data often comes without the context that makes it useful, like operator shifts, batch IDs, and factory constraints. Without that extra layer, AI-driven responses can miss the mark.
When should a factory use edge AI instead of cloud AI?
Use edge AI when manufacturing needs immediate, millisecond-level responses, like machine monitoring, process control, or real-time inference that helps prevent downtime and quality defects.
Because edge AI handles data locally, it avoids cloud latency and keeps working even when network connectivity is spotty. The cloud is a better fit for heavy computing, long-term trend analysis, company-wide reporting, and training complex AI models.