Predictive Maintenance 101: How to Catch Failures Before They Happen

Leela Yanamaddi
August 6, 2026
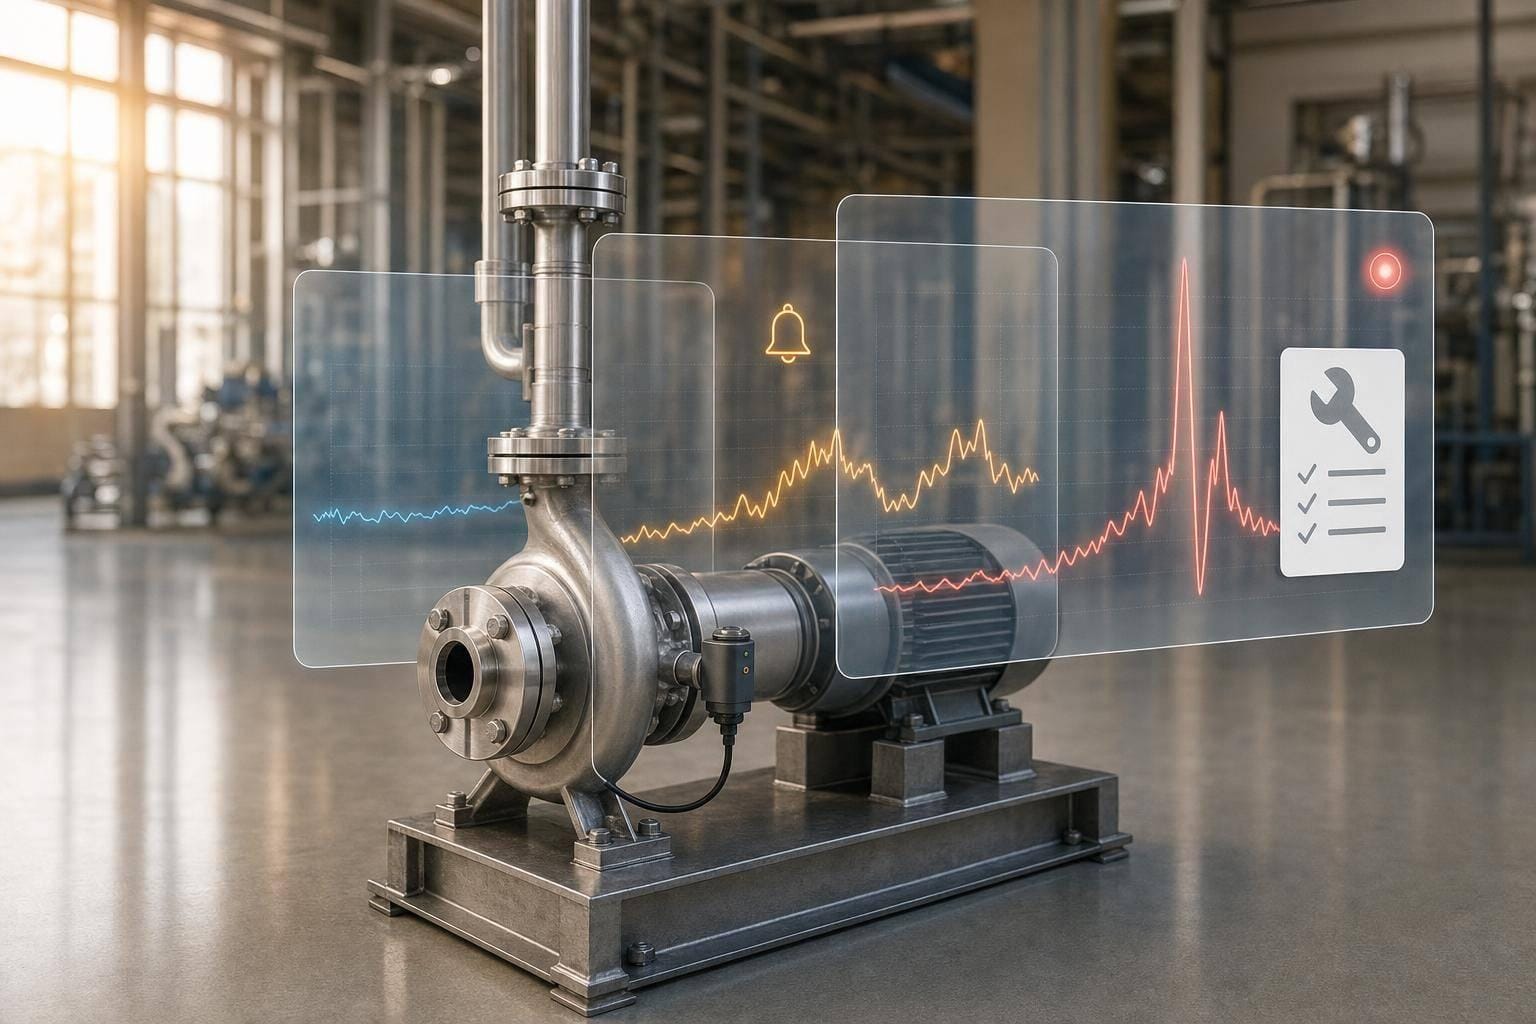
Most equipment gives you a warning before it fails. If you watch the right signals - like vibration, heat, current draw, fault logs, and cycle-time drift - you can spot wear days, weeks, or even months before a shutdown.
Here’s the short version:
- Reactive maintenance starts after failure. It has the highest cost.
- Preventive maintenance follows a fixed schedule. It often leads to extra service.
- Predictive maintenance starts when data shifts from normal. It gives you time to plan.
That matters because unplanned failures can cost manufacturers about $260,000 per hour.
If I had to boil this guide down, I’d say this:
- I match each asset to its most likely failure mode
- I track the first signal that usually changes
- I build a baseline from 2–4 weeks of normal data
- I start with thresholds and trend rules
- I turn alerts into work orders with clear action windows
- I test the setup on 10–20 high-impact assets in a 90-day pilot
- I measure MTBF, MTTR, downtime, false alarms, and repair cost avoided
A few examples make the idea simple:
- Bearings: vibration can show trouble 45–90 days early
- Robot joints: torque drift can point to reducer wear 4–8 weeks early
- Controllers: heat and voltage ripple can flag trouble 10–30 days early
- Conveyors: speed drift and belt tension issues can show up days to weeks before failure
The big idea is simple: don’t monitor everything first. Start with the assets that hurt the most when they stop, connect the data you already have, and make sure every alert leads to a clear maintenance step.
That’s how I’d explain predictive maintenance in plain terms: find early drift, act before failure, and keep improving the loop with technician feedback.
REACTIVE vs PREVENTATIVE vs PREDICTIVE Maintenance: A Complete Guide for Manufacturing & Engineering
Step 1: Match Failure Modes to the Signals That Appear First
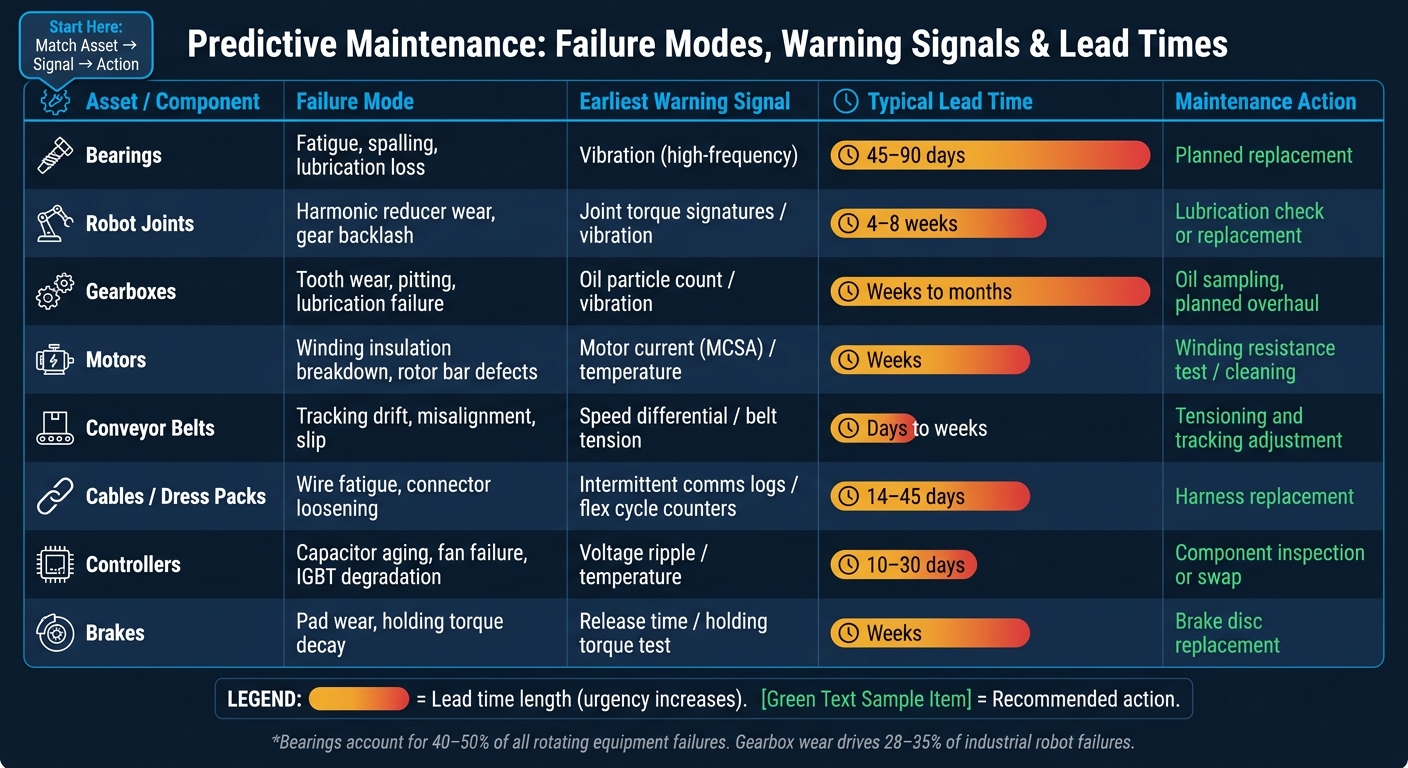
Predictive Maintenance: Failure Modes, Warning Signals & Lead Times
In the real world, predictive maintenance starts with a simple move: match each asset’s most likely failure mode to the first signal that shows up. Don’t start by tracking everything. Start with the failures you already expect, then tie each one to the earliest sign it gives off.
Common Failure Modes in Robots, Machines, and Warehouse Systems
Most failures in industrial settings come back to a small group of parts. Bearings account for 40–50% of all rotating equipment failures. Gearbox wear and degradation drive 28–35% of industrial robot failures. Cable and harness fatigue accounts for another 10–15% of failures.
After that, the issues that show up again and again include motor winding insulation breakdown, conveyor belt tracking drift, robot joint wear shown through cycle-time drift and position error, and controller component aging such as capacitor aging, fan failure, and IGBT degradation.
The key point is simple: each failure mode leaves its own early trail. So instead of watching every possible data point, focus on the signals that shift first for that asset type.
Signals That Predict Failure: Vibration, Temperature, Current, Logs, and Telemetry
Not all signals work on the same clock.
Vibration analysis is often the first warning sign for rotating equipment. It can detect bearing defects 45–90 days before failure. That kind of lead time gives maintenance teams room to schedule repairs instead of scrambling after a breakdown.
Temperature monitoring works later in the process. In many cases, it gives you hours to days of warning, which makes it better for spotting lubrication failures and cooling blockages that are already moving fast.
Motor Current Signature Analysis (MCSA) is useful because it can pick up problems without direct physical access to the motor. By looking at current draw, it can flag mechanical binding, rotor bar defects, and winding insulation breakdown.
For robots, cycle-time drift and joint torque signatures can be early signs of harmonic reducer wear. If one joint starts drifting, that can signal a gearbox issue before the whole system throws a fault.
Here’s how that mapping looks in practice:
| Asset/Component | Failure Mode | Earliest Warning Signal | Typical Lead Time | Maintenance Action |
|---|---|---|---|---|
| Bearings | Fatigue, spalling, lubrication loss | Vibration (high-frequency) | 45–90 days | Planned replacement |
| Robot Joints | Harmonic reducer wear, gear backlash | Joint torque signatures / vibration | 4–8 weeks | Lubrication check or replacement |
| Gearboxes | Tooth wear, pitting, lubrication failure | Oil particle count / vibration | Weeks to months | Oil sampling, planned overhaul |
| Motors | Winding insulation breakdown, rotor bar defects | Motor current (MCSA) / temperature | Weeks | Winding resistance test / cleaning |
| Conveyor Belts | Tracking drift, misalignment, slip | Speed differential / belt tension | Days to weeks | Tensioning and tracking adjustment |
| Cables/Dress Packs | Wire fatigue, connector loosening | Intermittent comms logs / flex cycle counters | 14–45 days | Harness replacement |
| Controllers | Capacitor aging, fan failure, IGBT degradation | Voltage ripple / temperature | 10–30 days | Component inspection or swap |
| Brakes | Pad wear, holding torque decay | Release time / holding torque test | Weeks | Brake disc replacement |
This is why calendar-based maintenance often falls short. Many failures are random, not tied neatly to age. A part doesn’t fail just because the calendar says it should. It fails when its signals start to drift.
Once you know the failure mode, the next move is to connect the right sensors, logs, and telemetry, then set a baseline.
Step 2: Build the Monitoring Stack and Set Baselines
Once you've mapped failure modes, the next move is to connect the data sources that show drift and pin down what normal looks like for each asset.
Sensors, Telemetry, and Data Sources to Connect First
Start with the data you already have before spending money on new hardware. Most robot controllers already expose torque, joint temperature, position error, cycle counts, and alarms through OPC-UA, a common industrial standard for pulling native controller data.
For rotating equipment, begin with vibration monitoring. MEMS accelerometers are a good fit for assets running below 3,000 RPM. Piezoelectric sensors are better for high-speed or mission-critical gearboxes that need response up to 10 kHz. If you're setting a permanent baseline, use stud mounting or industrial adhesive on a flat, machined surface. Magnetic mounts work better for temporary route-based checks, since they damp high-frequency signals.
Vibration isn't enough on its own. Add thermal monitoring for motors, drive amplifiers, and gearboxes. You can also use existing servo drive data for Motor Current Signature Analysis to spot electrical faults, mechanical binding, and winding insulation breakdown without adding hardware. For external sensors, use MQTT to stream data to an edge gateway or the cloud.
How to Build a Normal Operating Baseline from Raw Data
Raw sensor data by itself doesn't say much. A motor running hotter could be fine under a heavy production load and a red flag during steady-state operation. Context turns raw numbers into something you can act on.
Collect 2 to 4 weeks of continuous data during normal operations before turning on alerts. That window helps you capture the full range of healthy states across shifts, payload changes, and ambient conditions. A cooling water pump in July, for instance, may not behave the same way it does in January because of changes in temperature and demand.
During that baseline period, tag raw data with operating context such as:
- Joint angles
- Velocity
- Payload weight
- Cycle counts
Also suppress data from startup, shutdown, and changeover events so transient spikes don't muddy the baseline. Once the data is clean, set limits relative to that asset's own baseline instead of leaning on generic industry ranges. A machine that usually runs at 1.8 mm/s is in trouble at 4.2 mm/s, even if that same reading would look normal on another asset.
When to Use Thresholds, Trend Rules, and Predictive Models
The smartest path here is simple: start simple, then add more advanced logic only when your data quality can support it.
Static thresholds are the best starting point for non-critical assets or assets still in the baseline stage. They trigger when one parameter crosses a set limit. They're easy to set up and easy for the maintenance team to understand. The tradeoff is false alarms if the limits aren't tuned well.
Trend analysis makes sense once you have 2 to 4 weeks of baseline history. Instead of watching for a fixed limit, you're watching for drift from that asset's normal range. That's how you catch slow bearing wear or gradual gearbox decline that a static threshold might miss.
Predictive models - including Isolation Forests and Autoencoders - make sense for critical assets with complex failure patterns, where missing an issue is costly. These models look at multiple signals at once and can forecast Remaining Useful Life (RUL). The catch is that they need high-fidelity historical data and, ideally, some failure event history for training.
| Approach | Setup Effort | Data Requirements | Best Use Case |
|---|---|---|---|
| Static Thresholds | Low | Real-time sensor value | Non-critical assets; simple safety limits |
| Trend Analysis | Medium | 2–4 weeks of historical data | Standard rotating equipment; detecting gradual wear |
| Predictive Models | High | Historical failure data + operational context | High-criticality assets (robots); forecasting RUL |
Start simple. Add complexity only when the data supports it. Once the monitoring stack is stable, the next step is turning alerts into maintenance actions.
Step 3: Turn Alerts into Maintenance Workflows and Actions
An alert only matters if it reaches the right person, with the right deadline and the right next step. Once your monitoring stack is live, the next job is simple to say and harder to do: turn alerts into actual maintenance work. The operating flow looks like this: sensor data → data stream → model → alert → work order → feedback.
Design Alert Tiers That Reflect Downtime Risk
Not every anomaly should stop a machine on the spot. A three-tier setup keeps the response in line with the risk and helps cut down on alarm fatigue. It also gives operators one shared response ladder across assets, so everyone knows what each alert means.
| Alert Level | Trigger Condition | Action Window | Technician Action |
|---|---|---|---|
| Tier 1: Information | Slight deviation from baseline | Within 7 days | Visual inspection, trend monitoring, grease sampling |
| Tier 2: Elevated Risk | Threshold breach or accelerating wear | Within 48 hours | Scheduled lubrication, belt alignment, battery swap, oil sample |
| Tier 3: Critical | Imminent failure; current spike or rapid heat rise | Immediate | Controlled shutdown, motor or reducer replacement, cable harness swap |
For Tier 3 alerts, auto-open the work order in the computerized maintenance management system (CMMS) with asset history, likely fault type, and required parts. That removes the slow handoff from person to person and keeps the alert-to-work-order path moving.
State-based alert filtering matters too. Gate alerts by operating state. For example, only check conveyor bearing vibration when the machine is in RUN mode, and suppress duplicate notices during planned shutdowns. That way, technicians spend time on the alerts that count instead of sorting through noise.
Typical Interventions for Robots, Conveyors, and Mobile Fleets
The fix should match the asset and the signal, not just the alert tier. For industrial robots, the most common interventions focus on harmonic drives and reducers, which make up 60% to 70% of all industrial robot joint failures. Early warning signs such as axis torque increases or position error alarms usually point to grease analysis and grease replenishment. And there’s a shop-floor detail that matters: when replenishing robot joint grease, always open the exit vent port first. Skip that step and you can blow the seals and destroy the motor. Battery replacement also has one key rule - keep the controller powered on so you preserve zero-position mastering data.
For conveyors, the main triggers are VFD torque upticks, encoder jitter, and bearing heat. The usual interventions are belt tracking adjustment, idler lubrication, and drive pulley realignment.
For mobile robot fleets, keep an eye on frequent navigation retries and battery health drift. Those signs often point to software or firmware issues, sensor cleaning needs, or cell imbalance. In these fleets, usage-based triggers tend to work better than calendar-based schedules. Tying maintenance to running hours or cycle counts helps avoid over-maintaining low-use units and under-maintaining heavily used ones.
How Human-in-the-Loop Operations Improve Maintenance Decisions
A walk-around still catches things sensors can miss, like a growling gearbox or a cable that’s started to rub. That extra context often makes the difference between stepping in at the right time and missing a failure.
Technician feedback closes the loop. When techs log what they actually found - worn bearing or false alarm - that input helps tune alert thresholds and improve model accuracy over time. Require technicians to close work orders with a finding code, then use that feedback to adjust thresholds and future alerts.
Step 4: Roll Out Predictive Maintenance Across a Facility
Start with a Pilot on High-Impact Assets
Once your alerts and workflows are set up, test the system on a small group of high-impact assets before you scale.
Don't try to instrument the whole facility at once. Start with 10–20 critical assets in a 90-day pilot. That could be one robotic cell or one bottleneck conveyor section - equipment that runs more than 1,000 hours per year and can cause downstream downtime if it fails. Use the last three months of downtime data to find the assets with the highest failure cost.
Pick assets with clear failure modes, simple data access, and an obvious downtime price tag. Build the pilot list from the failure modes and signals you've already mapped. Then use the same sensors, baselines, and alert tiers already defined for those assets.
Before launch, document 3–5 baseline KPIs. At a minimum, include:
- Mean Time Between Failures (MTBF)
- Mean Time to Repair (MTTR)
- Unplanned downtime rate
- Avoided repair costs in dollars
Measure Results and Expand the Program
When PepsiCo's Frito-Lay division ran a one-year pilot across four snack plants using predictive maintenance with machine learning, the outcome was zero unexpected breakdowns and more than 4,500 hours of avoided downtime. After that, the program expanded across nearly all U.S. Frito-Lay plants.
Track these metrics during the pilot:
| KPI | What It Tells You |
|---|---|
| MTBF | Whether early detection is preventing full failures |
| Unplanned Downtime Rate | Target: 45–50% reduction over baseline |
| False Positive Rate | Whether technicians can trust the alerts |
| MRO Parts Cost | Target: about 30% reduction via just-in-time procurement |
| Avoided Repair Costs ($) | Tracks savings in dollars |
These numbers tell you if early signals are stopping downtime before it starts. If the pilot performs well, move to the next asset tier, then add more shifts and sites. Link anomaly detection to CMMS work orders and extend the rollout across more shifts and locations.
After the first 60–90 days, review alert thresholds against actual failure events and false-positive rates. That check matters. If thresholds drift too far from what the equipment is doing in the field, teams stop trusting the alerts. Tight reviews keep the program useful as it grows.
Conclusion: The Core Building Blocks of Predictive Maintenance
After the pilot, the same loop should keep getting better as you expand.
Predictive maintenance is a closed loop: data, signal, alert, work order, feedback. Sensors spot drift. Alerts send the issue to the right people. Work orders trigger action. Technician feedback sharpens the next alert. Over time, maintenance moves away from reactive firefighting and toward planned intervention - protecting uptime and giving teams more lead time to act.
FAQs
How do I choose which assets to monitor first?
Prioritize assets by criticality instead of rolling this out across the entire plant all at once.
Start with the 10–20% of equipment where failure hits hardest in terms of production, safety, quality, and repair costs. That gives you the best place to start and keeps the project focused.
Look back at the last 24 months of maintenance history and downtime logs to spot repeat problem assets and bottleneck machines. From there, run a pilot to build baseline data, fine-tune alerts, and prove ROI before you expand.
What data do I need to start predictive maintenance?
Start with machine data, temperature readings, and past maintenance records. The signals that tend to matter most are vibration, motor current or torque, and temperature.
It also helps to pull in operating context such as cycle counts, load, speed, and error logs from PLC or SCADA systems. On top of that, CMMS history, including past failure modes and work orders, can point to warning patterns that show up before equipment breaks down.
How can I reduce false alarms in predictive maintenance?
Reduce false alarms by starting with 4 to 8 weeks of normal operating data. That gives you a healthy baseline for each asset. If you start flagging issues before that baseline is in place, false positives become much more likely.
From there, move past static thresholds and use AI-driven anomaly detection that looks at multiple signals at the same time, like vibration and temperature. It’s a lot like checking more than one symptom before calling something a problem.
A closed-loop process also matters. When technicians log what happened after each intervention, the models can learn from mistakes and get better over time.